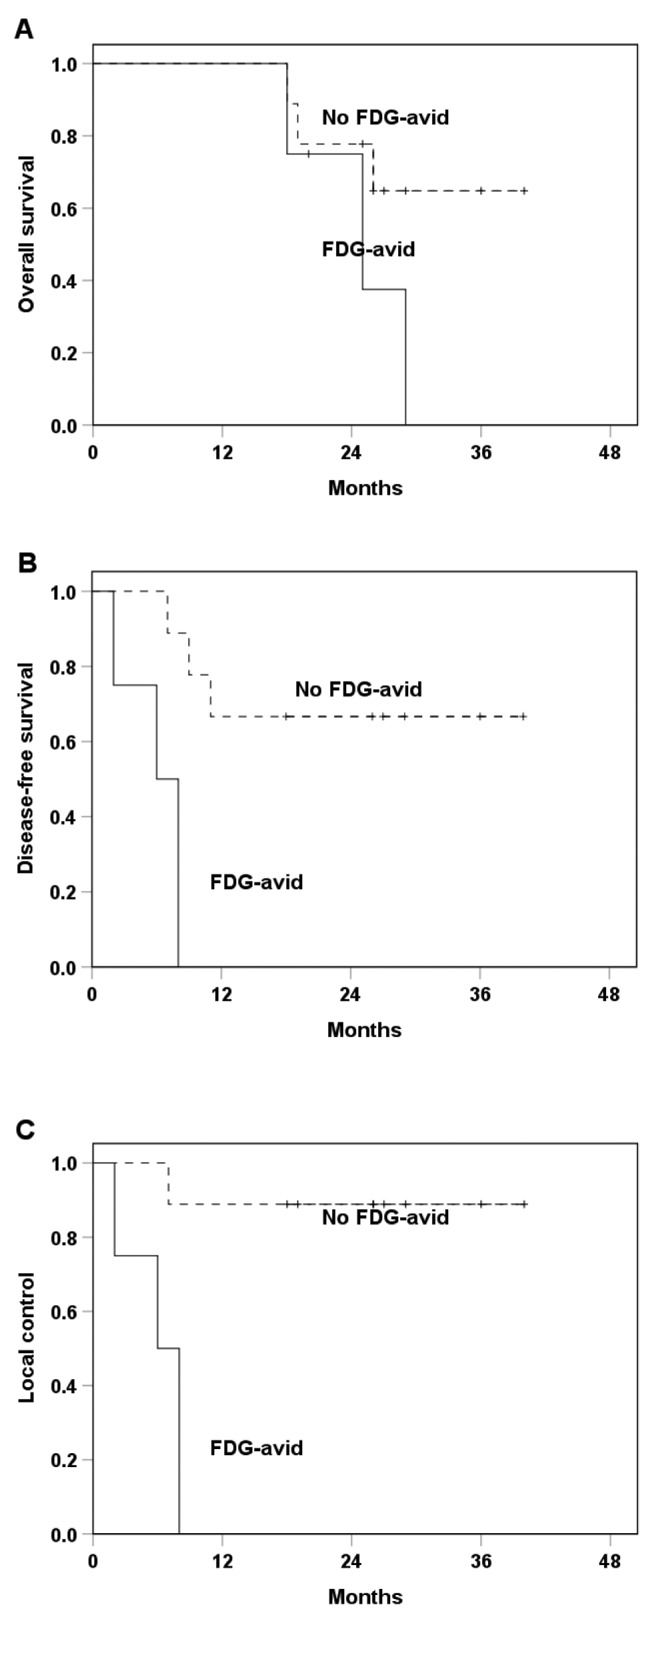
Figure 2. Kaplan–Meier curves of overall survival (OS) (A), diseasefree survival (DFS) (B), and local control (C) in association with the presence of 18F-fluorodeoxyglucose (FDG)-avid (n=4) and non FDGavid (n=9) primary tumors in the no concurrent chemoradiotherapy group.

