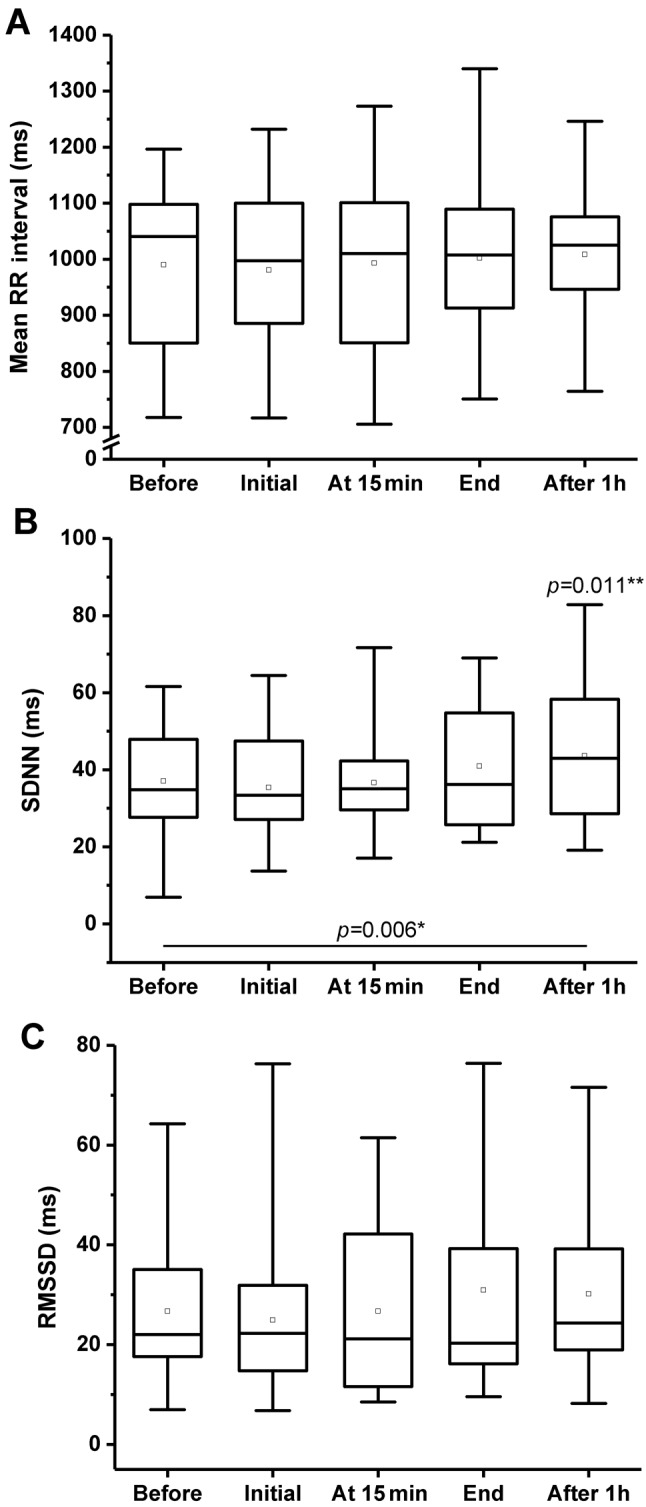
Figure 1. Time domain measurements before, during (at beginning and at15 min), and after (immediately and 1 h later) CO2 treatment. A: Meantime between two consecutive R-waves on the ECG (RR interval). B:Standard deviation of RR intervals (SDNN). C: Root mean square ofsuccessive RR interval differences (RMSSD). Boxes: Lower and upperquartiles, horizontal line: median value, whiskers: minimum and maximumvalues, square: mean value. *Friedman test p-value, **post-hoc Wilcoxon’spaired sample test p-values, only significant differences are indicated.

