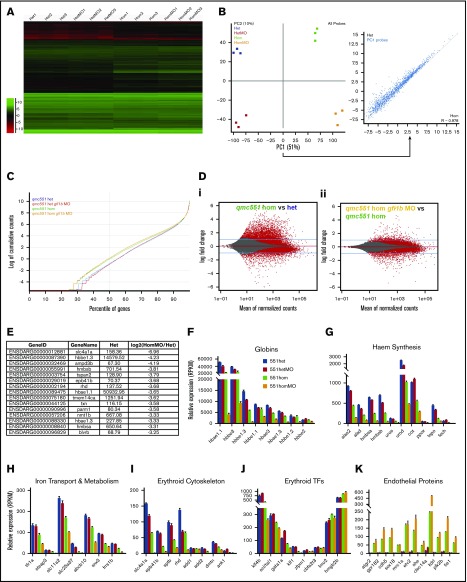
Figure 2.
Misregulation of hundreds of genes in Gfi1aa/Gfi1b-depleted primitive erythroblasts isolated from 20 hpf zebrafish embryos. (A) Hierarchical clustering of gene expression data determined for 3 replicate qmc551het, qmc551hetMO, qmc551hom, and qmc551homMO samples. The analysis included the 9785 genes that a DESeq2 analysis had identified as differentially expressed in qmc551het and qmc551homMO prRBCs. The Log2 values of the normalized expression counts are given. (B) Principal component analysis performed on the complete data set of 24 914 genes. The set of 1610 genes that made up principal component 1 allowed the distinction of qmc551het and qmc551hom samples. The scatterplot shown in the inset compares the average expression of these genes in 551het and 551hom samples. (C) The distribution of reads was analyzed by plotting the cumulative read counts for 4 representative samples (qmc551het1, qmc551hetMO3, qmc551hom3, and qmc551homMO1) over the percentiles of genes arranged in the order of ascending average gene expression. (D) A DESeq2 analysis had identified differentially expressed genes among the 24 914 genes analyzed. Here, MA plots (mean fold change over average expression) are shown that report M, the log2 value of the ratio of Hom/Het (left) and of HomMO/Hom (right), over panel A, the log2 value of the average expression in all Hom+Het (left) and HomMO+Hom values (right), for all of the 24 914 genes. All differentially expressed genes are shown in red. These were 8426 and 5081 in Di and Dii, respectively. The MA plot was generated using Bioconductor. (E) List of the top 15 genes with the highest fold decrease in expression in qmc551homMO vs qmc551het samples and an average expression of at least 60 RPKM in qmc551het prRBCs. (F-K) Bar charts comparing the normalized average expression levels of the named erythroid and endothelial genes in qmc551het, qmc551hetMO, qmc551hom, and qmc551homMO prRBCs. The standard deviations are shown. (L) List of the top 15 genes with the highest fold increase in expression in qmc551hom relative to qmc551het samples and an RPKM value of at least 40 in the qmc551hom prRBCs. (M) MA plot plotting genes based on their average expression in qmc551homMO and qmc551het and the mean of the ratio of average qmc551homMO to average qmc551het expression values. Genes are colored in blue when the DESeq2 statistical analysis showed that the differences in raw read counts were significantly different in qmc551homMO and qmc551het prRBCs. Typical endothelial and erythroid genes are highlighted in green and red, respectively. These genes are listed in supplemental Table 5. (N) Bar chart comparing the average normalized expression of the named globin and endothelial protein genes in all 4 sets of replicates. Standard deviations are shown. The bar color coding used in panels F-K and N is explained in panel F.


