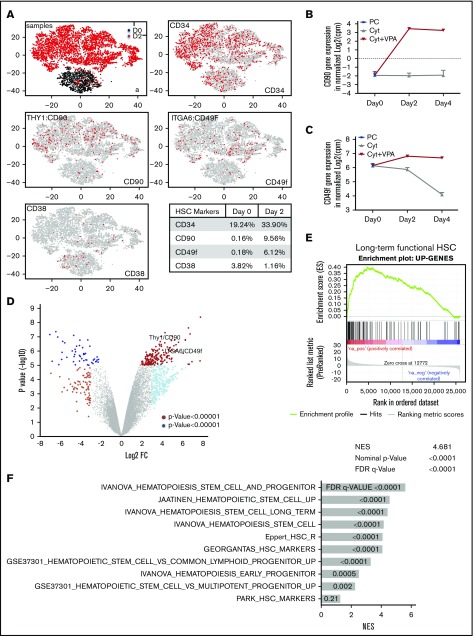
Figure 2.
VPA alters the transcriptional landscape of UCB-CD34+cells. (A) GEM drop-seq analysis of uncultured single CD34+(D0) and CD34+ cells isolated from cultures incubated for 2 days with VPA (D2). Gene expression data were plotted in 2D, using nonlinear projection t-SNE. Subpanel a indicates distinct clusters of cells D0 (black) and D2 (red). The other subpanels indicate expression of CD34, CD90, CD49f, and CD38 genes in each single cell (gray: not expressed, red: expressed). (B-C) Bulk RNA-seq analysis indicates CD90 (B) and CD49f (C) gene expression in the uncultured (PC), UCB-CD34+ cells (black triangle) and in CD34+ cells isolated from cultures expanded with cytokines alone (gray) or VPA (red). (D) Volcano plot represents differential expressed genes analyzed by bulk RNA-seq in CD34+ cells isolated from cultures expanded for 4 days with VPA compared with CD34+ cells expanded with cytokines alone (n = 3). VPA treatment upregulated 188 and downregulated 51 genes (log2 fold change, >4, with an FDR < 0.05). (E-F) The upregulated genes shown in panel D were enriched for the gene set that are upregulated in primate HSCs (E) and for other upregulated genes sets in human and murine HSCs and HSPCs (F) analyzed by GSEA. “n” is the number of biological replicates. cpm, counts per million; FDR, false discovery rate; NES, normalized enrichment score.

