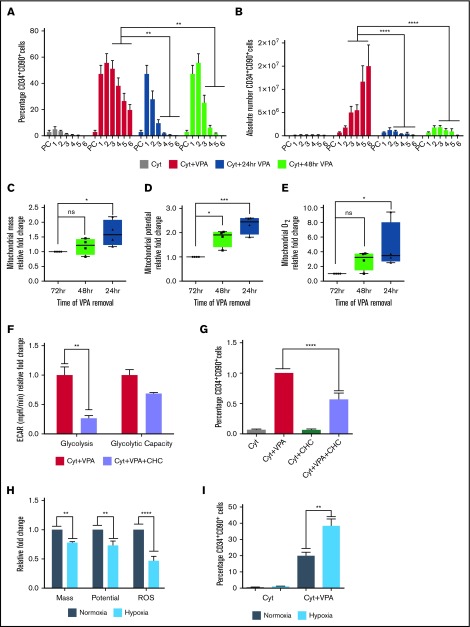
Figure 4.
Primitive mitochondrial profile accompanied by increased glycolysis is required for the acquisition of HSCs. (A-B) Effect of VPA withdrawal at different points on the percentage (A) and absolute number (B) of CD34+CD90+ cells generated by treatment with VPA or cytokines alone throughout the 6-day culture period (n = 5). X-axis represents days of the culture, and PC denotes the uncultured UCB cells. (C-E) Effect of VPA removal after various intervals on mitochondrial mass (C), membrane potential (D), and superoxide anion levels (E) of CD34+CD90+ cells cultured for 4 days. Graphs represent fold change of MFI values of MitoTracker Green, tetramethylrhodaminemethyl ester, and MitoSOX relative to the corresponding values observed in CD34+CD90+ cells that were continuously exposed for 72 hours to VPA (n = 4). (F) Glycolysis activity measured by ECAR in VPA expanded CD34+ cells in the presence or absence of 2-cyano-3-(4-hydroxyphenyl)-2-propenoic acid. (G) Effect of glycolysis inhibition on the percentage of CD34+CD90+ cells expanded for 2 days with VPA in the presence of 1 mM 2-cyano-3-(4-hydroxyphenyl)-2-propenoic acid. (H) Effect of hypoxia on mitochondrial mass, potential, and ROS levels of CD34+CD90+ cells expanded for 4 days with VPA (n = 4). (I) Effect of hypoxia on the percentage of CD34+CD90+ cells generated by the end of the expansion period (n = 4). “n” is the number of biological replicates. Error bars with standard error of the means, ****P ≤ .0001; ***P ≤ .001; **P ≤ .01; *P ≤ .05 were determined by β models for panel B, negative-binomial models for panel C, and 2-way ANOVA for panels D-H.

