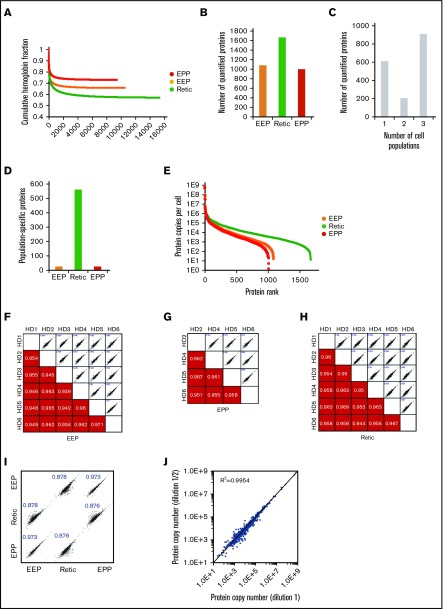
Figure 2.
Overall analysis of the proteomic data for whole-cell preparations. (A) Contribution of globin MS signal to the MS signal of all identified proteins. Identified peptides were ranked according to their intensity and the contribution of globin peptides to the sum of the intensities of all identified peptides was calculated at each point. (B) Number of proteins quantified in the EEP, EPP, and Retic populations. (C) Number of proteins quantified in single-cell, 2-cell, or 3-cell populations. (D) Number of proteins only quantified in the EEP, Retic, or EPP cell population. (E) Dynamic range of protein quantification in the EEP, EPP, and Retic cell populations. Proteins were ranked according to their expression level. (F-H) Reproducibility of the quantifications in the different experiments. The numbers in the bottom panels indicate Pearson correlation coefficients. (I) Relationship between protein expression levels in the EEP, EPP, and Retic cell populations. Numbers are Pearson correlation coefficients. (J) The absolute quantification is not affected by dilution of the analyzed peptides. SCX fractions were analyzed directly and after a twofold dilution.

