Figure 3.
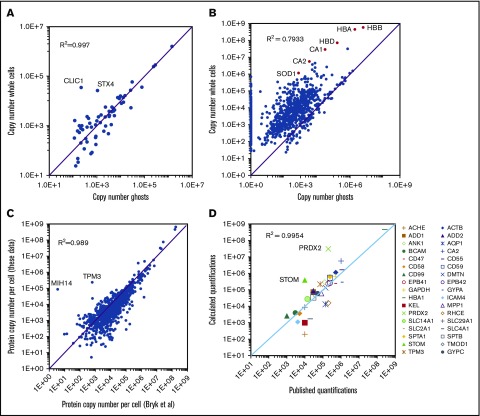
Absolute protein quantification in whole-cell and in ghost preparations. (A) Comparison of the quantification values for transmembrane proteins. Proteins with transmembrane domains were selected using the keyword annotations in Uniprot. Proteins quantified in both whole-cell and ghost preparations were selected and the quantification values were compared. (B) Comparison of the quantification values for all proteins quantified in the whole-cell preparations. (C) Comparison of the quantification values obtained in the present study with those reported previously by Bryk and Wiśniewski.19 (D) Comparison of the present study quantification values with those obtained by biochemical methods and compiled by Burton and Bruce14 except for HBA1, which was calculated starting from a hemoglobin content of 30 pg per erythrocyte and CA2 that was obtained from Sterling et al.27

