Figure 5.
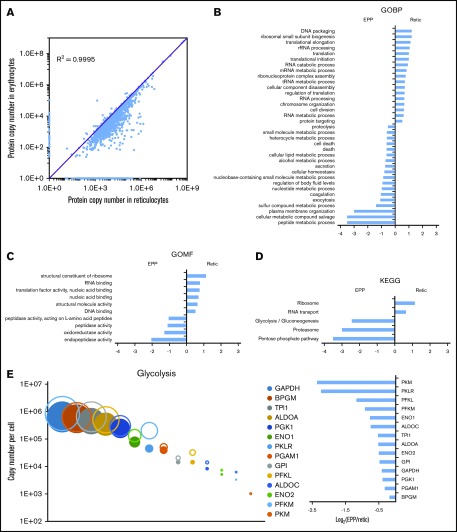
Modifications of the red cell proteome during reticulocyte maturation. (A) Comparison of the expression level of each quantified protein in reticulocytes and erythrocytes. (B-D) Proteins whose expression decreased by at least 90% during reticulocyte maturation, including proteins that were no longer detected in erythrocytes, were compared with the proteins quantified in erythrocytes that did not present such a decrease during reticulocyte maturation. Term enrichment analysis in these 2 sets of proteins was done with Perseus software using annotations from the Kyoto Encyclopedia of Genes and Genomes (KEGG), from the Gene Ontology Biological Process (GOBP), or from the Gene Ontology Molecular Functions (GOMF) databases. (E) Modification of the expression level of glycolysis pathway proteins during reticulocyte maturation. Expression level (as copy number per cell) of each protein in the reticulocytes (open circles) and in the erythrocytes (closed circles) is indicated (right panel), the expression ratio in erythrocyte vs reticulocyte is indicated (left panel).

