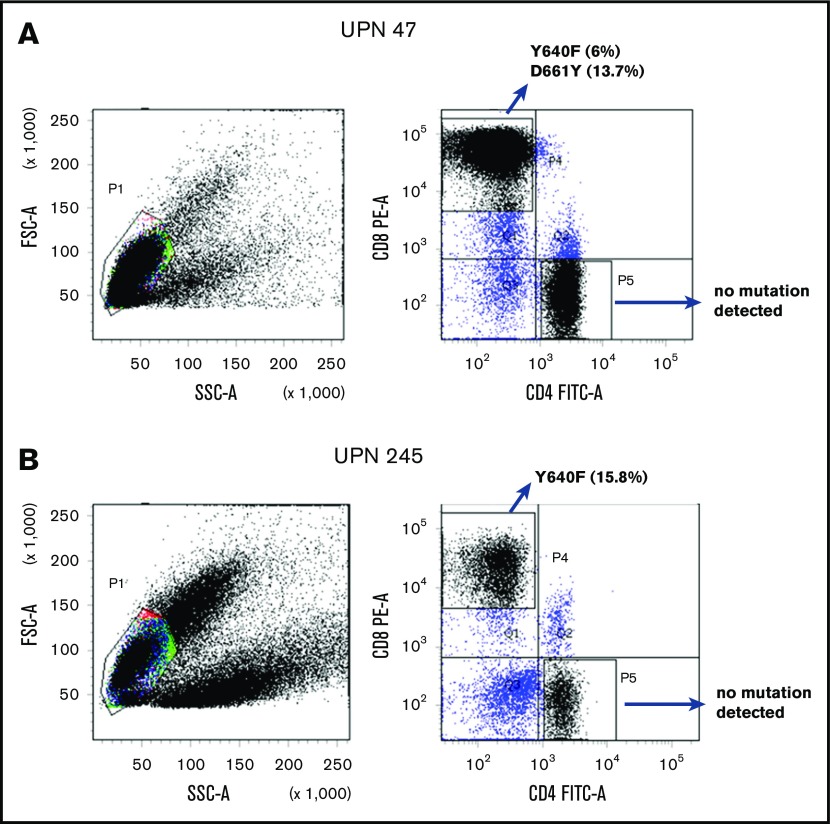
Figure 2.
Representative examples of scatterplots of sorted lymphocytes and the results of amplicon sequencing for the STAT3 genes in sorted fractions. STAT3 mutations were not found in CD4+ T-cell fractions but were found in CD8+ T-cell fractions of UPN 47 (A; idiopathic PRCA) and UPN 245 (B; thymoma-associated PRCA). FITC-A, fluorescein isothiocyanate–area; FSC-A, forward scatter–area; PE-A, phycoerythrin-area; SSC-A, side scatter–area.

