Figure 3.

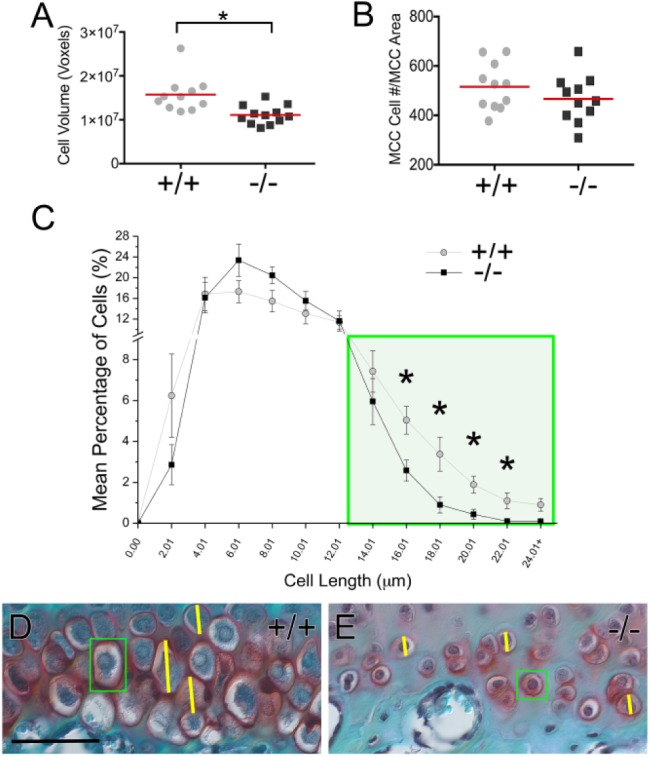
Adamts5–/– mandibular condylar cartilage (MCC) exhibits a reduction in large hypertrophic chondrocytes. Comparison of fibrocartilage cell volume of Adamts5+/+ (+/+; n = 11) and Adamts5–/– (–/–; n = 12) was calculated for the MCC (A). Total number of cells in a 200× field of MCC was quantified (B). Lengths of all mandibular condylar cartilage cells were measured (ZenPro) for each murine MCC, grouped into 2-µm cell ranges using a binning graph. Y-axis indicates the percentage of cells in each size range (C). Green box denotes cell ranges that represent mature hypertrophic cells (i.e., length 16 to 24 µm) (C). D and E show Safranin O–stained images of the hypertrophic zone in 2-mo Adamts5+/+ and Adamts5–/– condylar tissue. Green boxes (D and E) highlight hypertrophic fibrocartilage cells in 2-mo Adamts5+/+ and Adamts5–/–, respectively. Yellow lines denote diameter measurements. Scale bar: D = 50 µm applies to E. *P ≤ 0.05. This figure is available in color online.
