Fig. 5.

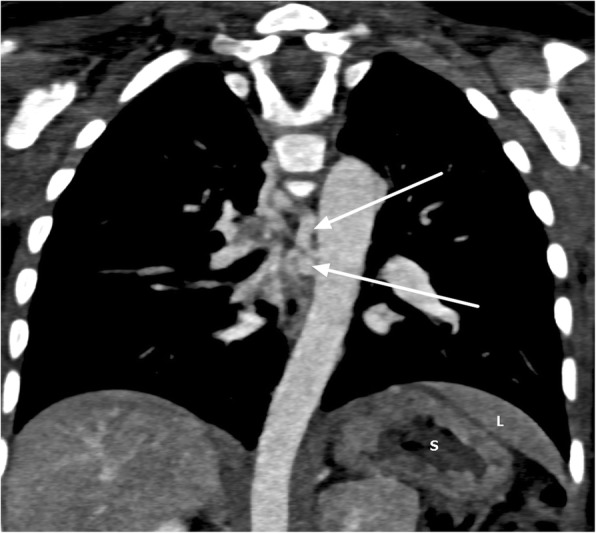
Coronal maximum intensity projection showing major aortopulmonary collateral arteries (arrows), stomach on the left side (S) and part of liver (L) above the stomach

Coronal maximum intensity projection showing major aortopulmonary collateral arteries (arrows), stomach on the left side (S) and part of liver (L) above the stomach