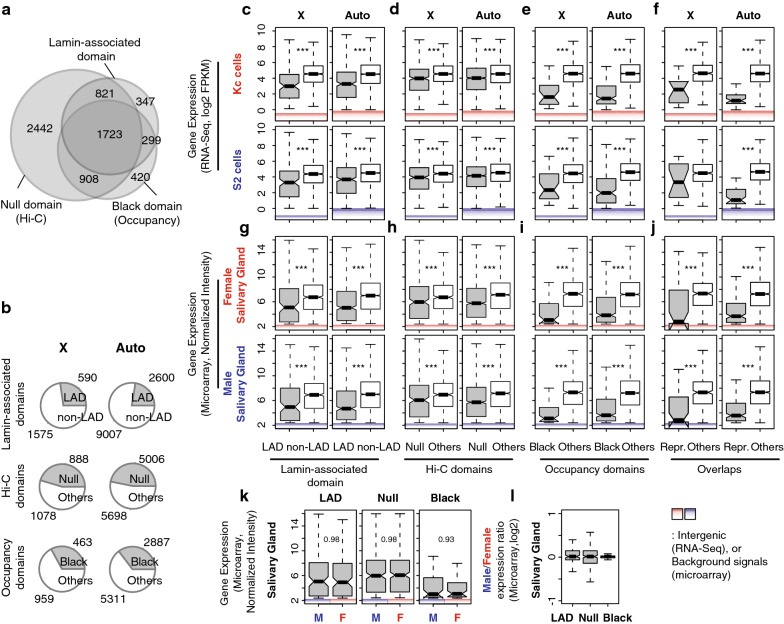
Fig. 1.
Repressive TAD genes display lower gene expression levels and are dosage compensated in male cells. a Venn diagram displays overlap among the three repressive TADs that are described in this study. b Pie charts demonstrate the proportion of repressive TAD genes (gray) versus non-repressive TAD genes (white) in Drosophila genome. In a and b, only protein-coding polyA+ genes are counted. The numbers do not directly indicate numbers of “expressed” genes in each TAD. c–j Gene expression levels from the repressive TAD genes (gray) and non-repressive TAD genes (white) based on LAD (c, g), Hi-C (d, h), chromatin occupancy studies (e, i) and their overlaps (f, j). The top two rows show RNA-Seq results from Drosophila cell lines (unit: log2 FPKM, c–f), and the bottom two rows are from a microarray study done with larval salivary glands (unit: normalized signal intensity, e–j). Intergenic signals from the 99th percentiles and below in RNA-Seq analyses, as well as background signals from the 99th percentiles and below in the microarray result, are indicated. k Comparisons of X chromosome gene expression levels from the repressive TADs between female and male salivary glands. l Comparisons of male X chromosome genes from the repressive TADs to the same gene in females. Boxplots indicate the distribution of gene expression levels above expression cutoffs. Middle lines in box display medians of each distribution. Top of the box. 75th percentile. Bottom of the box. 25th percentile. Whiskers indicate the maximum, or minimum, observation within 1.5 times of the box height from the top, or the bottom of the box, respectively. Notches show 95% confidence interval for the medians. ***p < 0.001 from Mann–Whitney U test. The same format and test have been used for all boxplots appeared in this study

