Fig. 3.
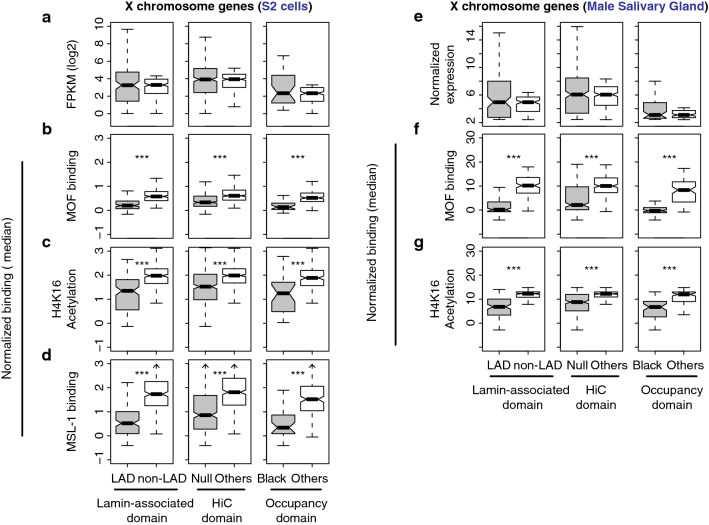
Lower occupancy of MOF and H4K16Ac levels in the X-linked genes within repressive TAD compared to non-repressive TAD genes with similar expression levels. a Boxplots display gene expression levels from S2 cells in FPKMs. The X-linked repressive TAD genes (gray) and genes from non-repressive TADs (white) were compared; for the latter, highly expressed genes were removed to equalize the medians. b–c MOF occupancy, H4K16Ac level or MSL-1 binding of the genes in (a). e X chromosome gene expression levels from male salivary glands where the median expression of non-repressive TAD genes is matched to that of the repressive TAD genes as in (a). f, g MOF occupancy and H4K16Ac levels for the genes in (e)

