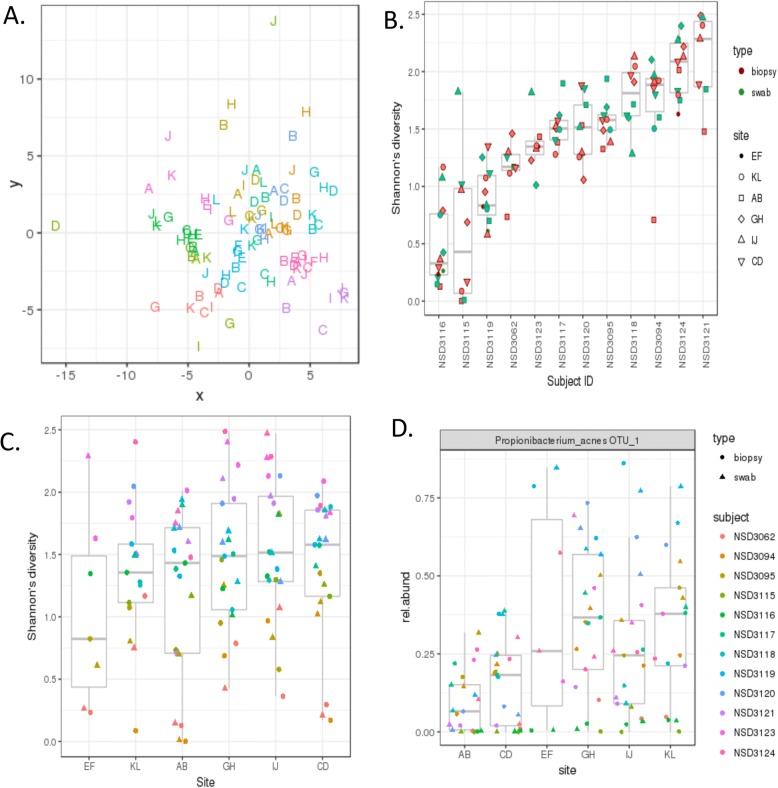
Fig. 10.
Diversity of the human sinonasal microbiome by patient, site, and type. a NMDS ordination of log-transformed Euclidean distance matrix of relative OTU abundances in human sinonasal specimens. Some clustering is observed by patient (color), little to no clustering by site (size), or type (shape). b Box-plot of the variation in diversity among sites. The x-axis has all the sites used in the sinonasal community sequencing, and the y-axis represents the diversity. Coloring is based on the sample type (swab or biopsy). c OTU richness and Shannon’s effective number of OTU. Box-plot of number of OTUs observed in each patient. The colors are based sample type (swab or biopsy). d Box-plot of Shannon’s effective number of species observed in each patient. The colors are based sample type (swab or biopsy)

