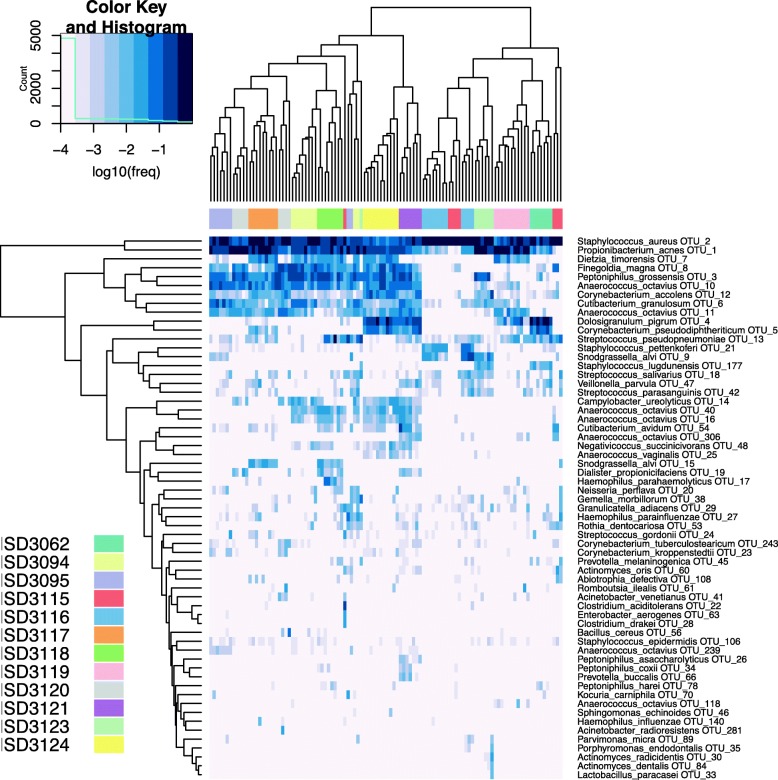
Fig. 9.
Heatmap of human sinonasal microbiome from 12 subjects. Columns are subjects; rows are species. OTU counts were summed by species-level centroid classification, samples with < 500 reads were excluded, then species with < 0.2% relative abundance in all samples were dropped. Remaining OTU counts were converted to relative abundances and then log-transformed after adding a pseudocount (1 / # of reads in sample) before hierarchical clustering, showing strong clustering by subject (horizontal colored strip, with different colors indicating the sample’s subject)

