
Fig. 3.
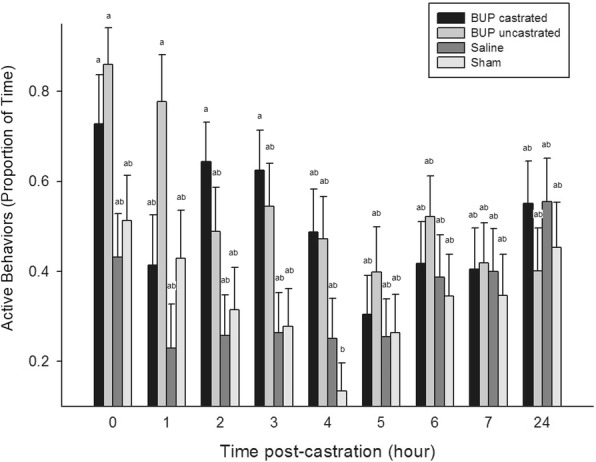
Mean proportion of time (± SE) piglets engaged in active behaviors within each treatment group across the observation period. Different letters indicated significance
Official websites use .gov
A
.gov website belongs to an official
government organization in the United States.
Secure .gov websites use HTTPS
A lock (
) or https:// means you've safely
connected to the .gov website. Share sensitive
information only on official, secure websites.
Mean proportion of time (± SE) piglets engaged in active behaviors within each treatment group across the observation period. Different letters indicated significance