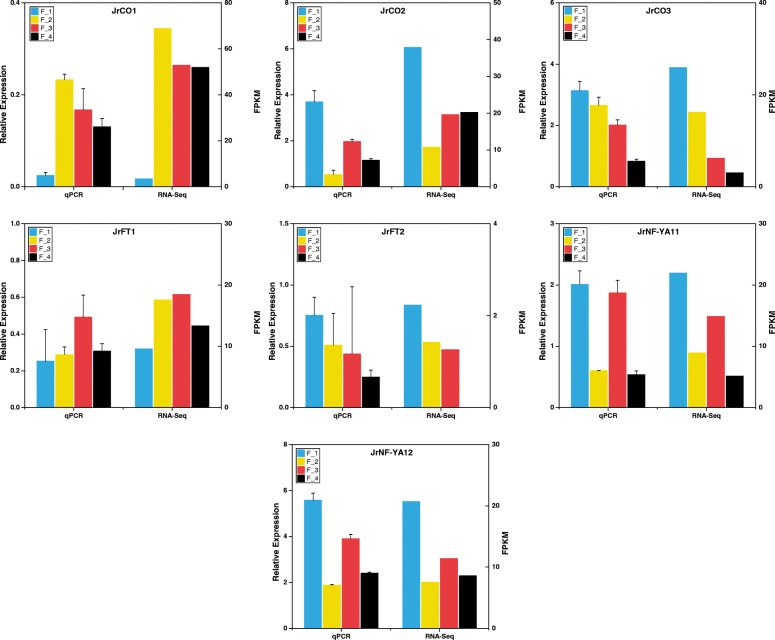
Fig. 7.
Expression profile of JrCOs, JrFTs and differential expressed JrNF-Ys. Relative expression levels of two differential expressed JrNF-Ys (JrNF-YA11, JrNF-YA12), three JrCOs (JrCO1, JrCO2, JrCO3), and two JrFTs (JrFT1, JrFT2) were obtained from qPCR experiments and were used to construct a heatmap. The data normalization was performed with the computing method of log10 + 2

