
Fig. 4.
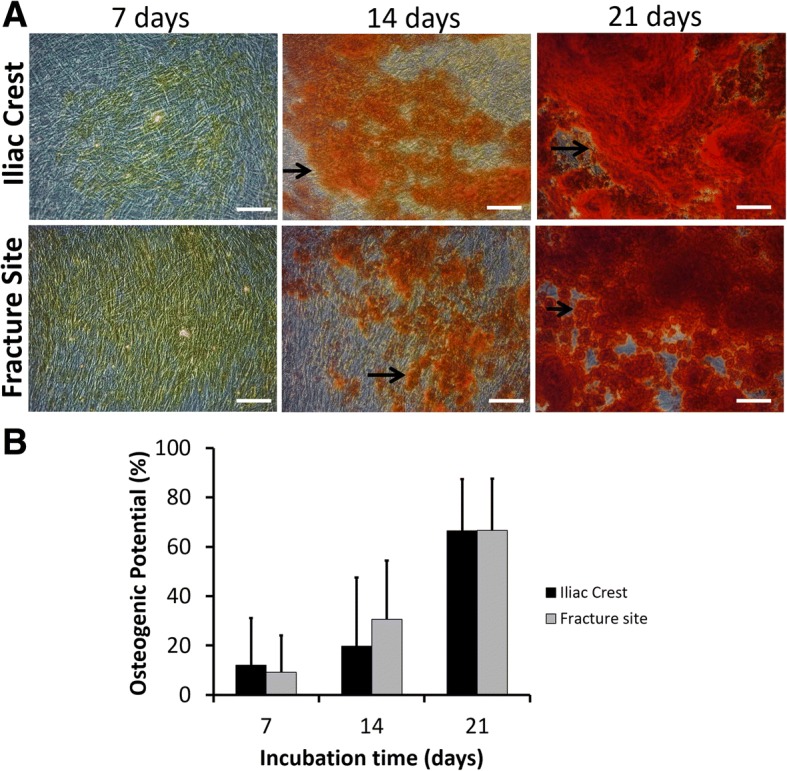
Osteogenic differentiation of MSCs isolated from the iliac crest and fracture site of the tibia from CPT patients. a Representative microscopic images of osteogenic assays. Bars and black arrows indicate 100 μm and osteocytes population, respectively. b Percentage of osteogenic differentiation potential. Data were shown as means, and the vertical bars indicated standard deviations (n = 6)