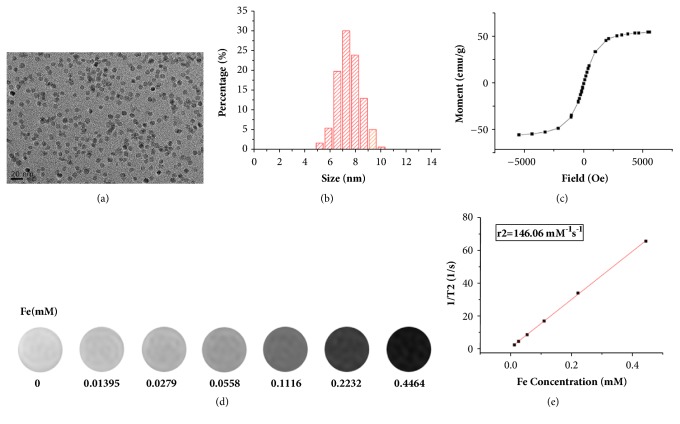
Figure 1.
Characterization of the USPIOs. (a) TEM image of the USPIO nanoparticles. (b) Distribution of USPIO core size. (c) Magnetization curve of USPIO nanoparticles. (d) Concentration-dependent T2-mapping of USPIO nanoparticles on 3.0 T MR in vitro. (e) T2 relaxation time at various iron concentrations. Data are recorded as the mean ± SD. TEM indicates transmission electron microscope.

