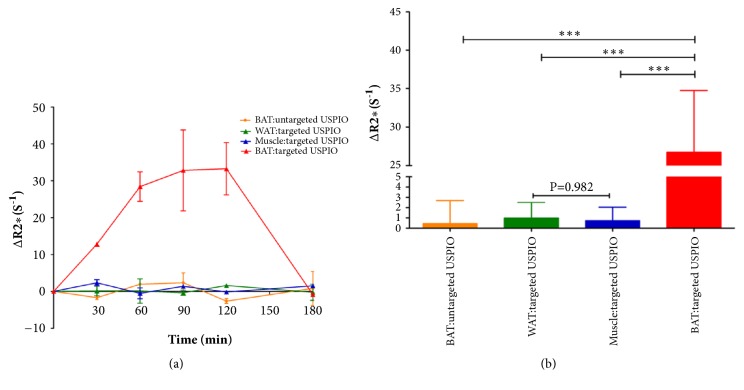
Figure 3.
Quantitative analysis of ΔR2∗ values. (a) The ΔR2∗ values curve of BAT, WAT, and muscle in targeted group and BAT in control group injected with targeted USPIO or untargeted USPIO, respectively (n = 2). The error bars represent the SD of ΔR2∗ for two mice in different group. (b) Statistic analysis of ΔR2∗ values in the BAT in control group and WAT, muscle, and BAT in targeted group (n = 7). ∗∗∗ P<0.001. The error bars represent the SD of ΔR2∗ for seven mice in different group. Data are recorded as the mean ± SD.

