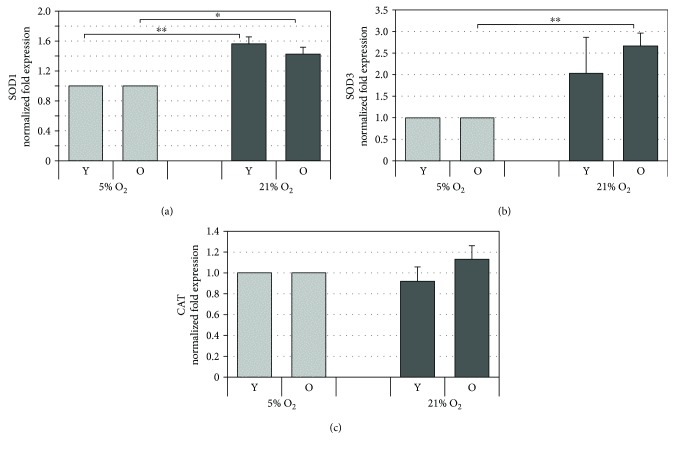
Figure 7.
Gene expression analysis of superoxide dismutases (SOD) 1 and 3 and catalase (CAT), in HDF assessed by qPCR. The histograms show the modulation of SOD1 (a), SOD3 (b), and CAT (c) mRNA by oxygen tension (21% O2 vs 5% O2) at matched cell passages in young (Y) and old (O) HDF. The genes were normalized vs GAPDH/β-actin/SDHA and the results are reported as normalized fold expression. Error bars represent SD. ∗ p < 0.05; ∗∗ p < 0.01.

