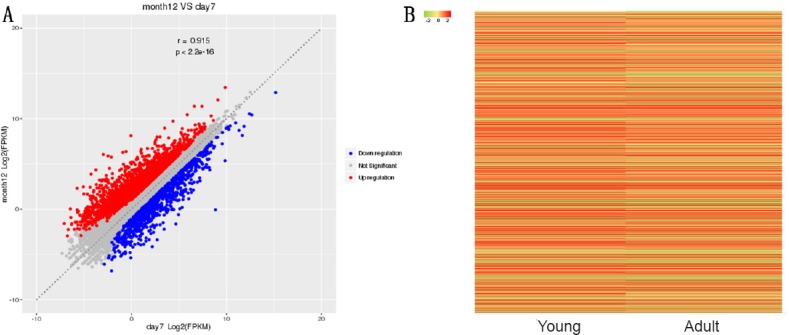
Figure 1.

Scatter map and heat map of mRNA expression in the sciatic nerve in young (1 week old, n = 4) and adult (12 months old, n = 4) Sprague-Dawley rats.
(A) Scatter map of mRNA expression. Red indicates upregulated genes in adult rats compared with young rats, while blue indicates downregulated genes. (B) Heat map of mRNA expression. Green in the heat map indicates a fold change ≤ 2, and red indicates a fold change > 2.
