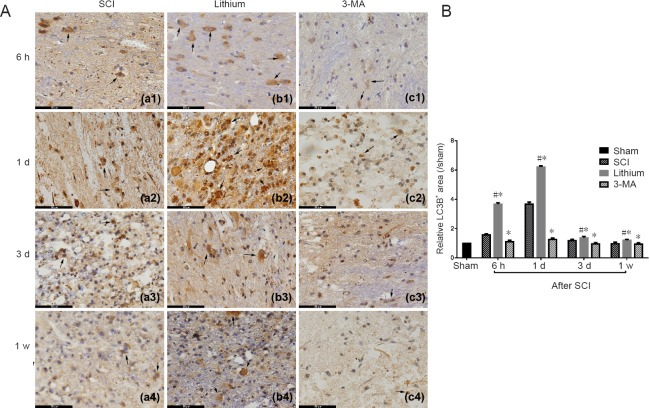
Figure 5.
Immunohistochemical staining for LC3B and the relative LC3B+ area in the injured spinal cord at different time points.
(A) Number of LC3B+ cells and the intensity of staining were greater in the lithium group than in the other groups at 6 hours, 1 and 3 days, and 1 week. Arrows point to LC3B protein. Scale bars: 50 μm. (B) The relative LC3B+ area was larger in the lithium group than in the SCI and 3-MA groups, while it was lower in the 3-MA group than in the SCI group. All data are expressed as the mean ± SD (n = 3; one-way analysis of variance followed by the least significant difference post hoc test). *P < 0.05, vs. SCI group; #P < 0.05, vs. the 3-MA group. SCI: Spinal cord injury; 3-MA: 3-methyladenine; h: hours; d: day(s); w: week.

