FIGURE 3.
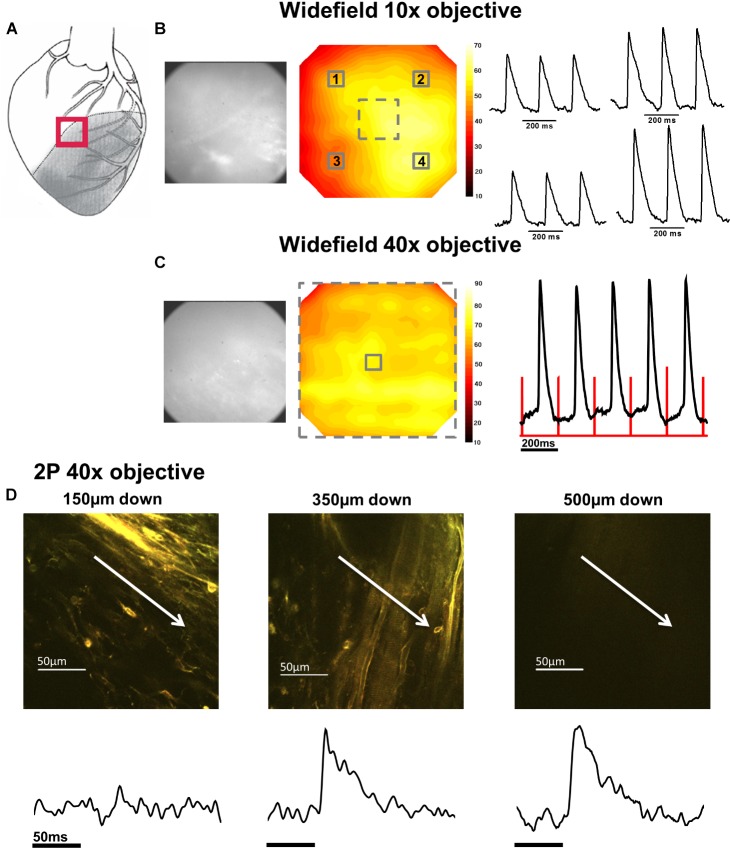
Widefield and 2P signals in the border zone (BZ). (A) Schematic diagram of the infarcted heart. The red square indicates the approximate location of the measurements in the BZ. (B) Widefield measurements taken from BZ tissue using a 10× objective. From left to right; CMOS camera image of di-4-ANEPPS fluorescence; contour map of di-4-ANEPPS signal-to-noise; 3 × 3 pixel averages (indicated by numbered solid squares in contour map) of action potentials (APs). (C) Measurements were then focused to a smaller area using a 40× objective [indicated by the dashed square on contour map in (B)]. From left to right; CMOS camera image of di-4-ANEPPS fluorescence in the BZ; Contour map of signal-to-noise in the 40× field of view; 3 × 3 pixel average of the AP signal in the center of the optical field, defined by the solid square in the contour map – red lines indicate timing of the stimulus pulse. A series of 2P measurements were made through increasing depth in the same optical field with the 40× objective. (D) 2P images and corresponding voltage measurement taken at (from left to right) 150, 350, and 500 μm below the epicardial surface. Myocardial structures could no longer be identified in 2P images at 500 μm; however, electrical activity was still observed at this depth. White arrows in images indicate approximate length and direction of line scans. All the APs shown are an average of 25 APs recorded over a period of 5 s.

