FIGURE 5.
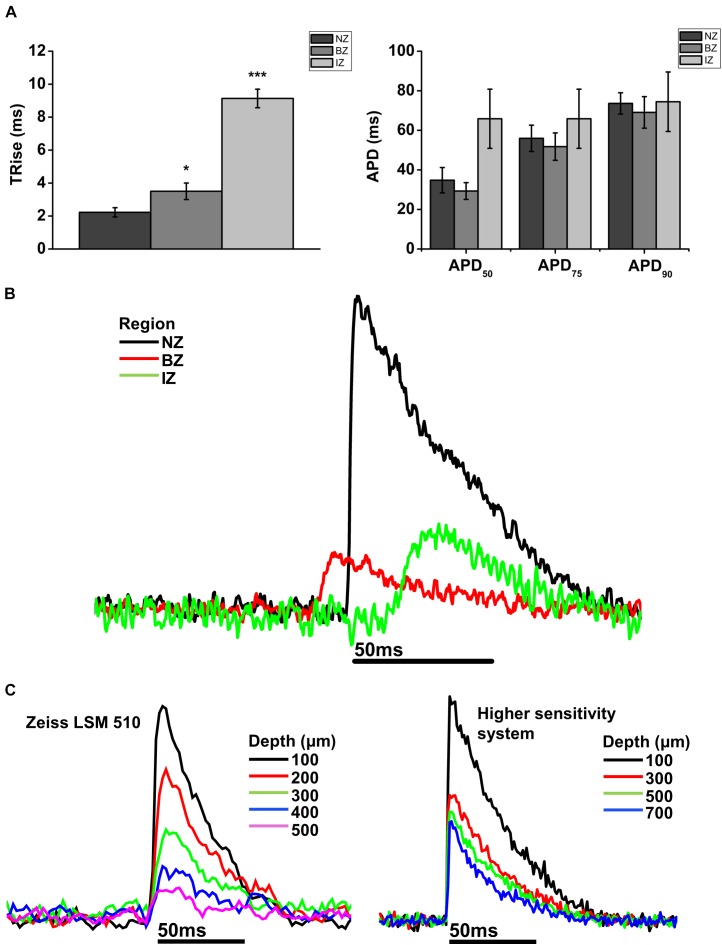
Comparison of AP parameters in normal zone (NZ), border zone (BZ), and infarct zone (IZ). (A) Mean 10–90% upstroke rise time (TRise) and mean action potential duration (APD) at 50, 75, and 90% repolarization obtained from 2P signals for each heart in each region. NZ, n = 6; BZ, n = 4, IZ, n = 3. ∗p < 0.05; ∗∗∗p < 0.001. (B) Representative traces from a rat MI heart showing action potentials recorded using 2PLSM from three imaging zones: Normal zone (NZ), borderzone (BZ), and infarct zone (IZ). AP upstroke was slowed in both BZ and IZ compared to NZ, with no obvious difference in APD. (C) Transmural action potentials recorded using two microscope systems: Zeiss LSM 510 (left) and a microscope system featuring optimized detection and optical configuration (right). Note there was no change in AP morphology with either imaging system over the depth range investigated.

