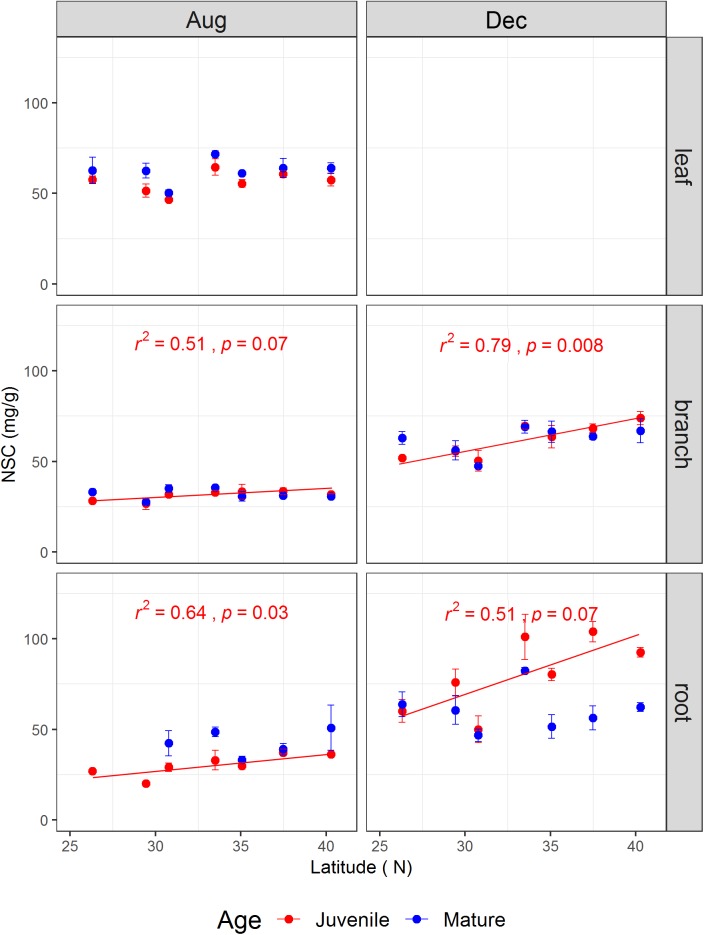
FIGURE 2.
The non-structural carbohydrate concentrations (mg/g) (mean ± se, n = 3) across life stages (juveniles vs. mature), tissues (leaf, branch, and fine root), and sampling seasons (growing season: Aug, 2014; and dormant season: Dec, 2014) along the latitudinal gradient. For each subplot, blue color denotes mature individuals and red denotes juveniles; fitted curves, determinant coefficients, and p-values of simple linear regression are given.

