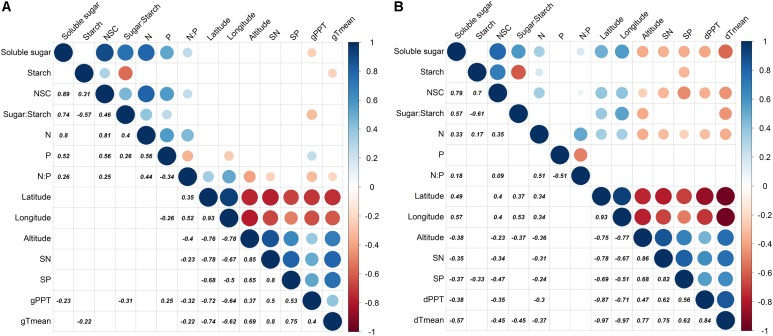
FIGURE 4.
Partial correlation analysis for dependent variables (soluble sugar, starch, NSC, ratio of sugar to starch, N, P, and ratio of N to P) and environmental factors (latitude, longitude, elevation, soil N, soil P, precipitation, and monthly mean temperature) where tree age and tree tissue were regarded as control factors [(A): growing season; (B): dormant season]. Significantly positive or negative correlations (p < 0.05) are displayed in blue and in red color, respectively; and color intensity and circle size are proportional to the correlation coefficients.

