Figure.

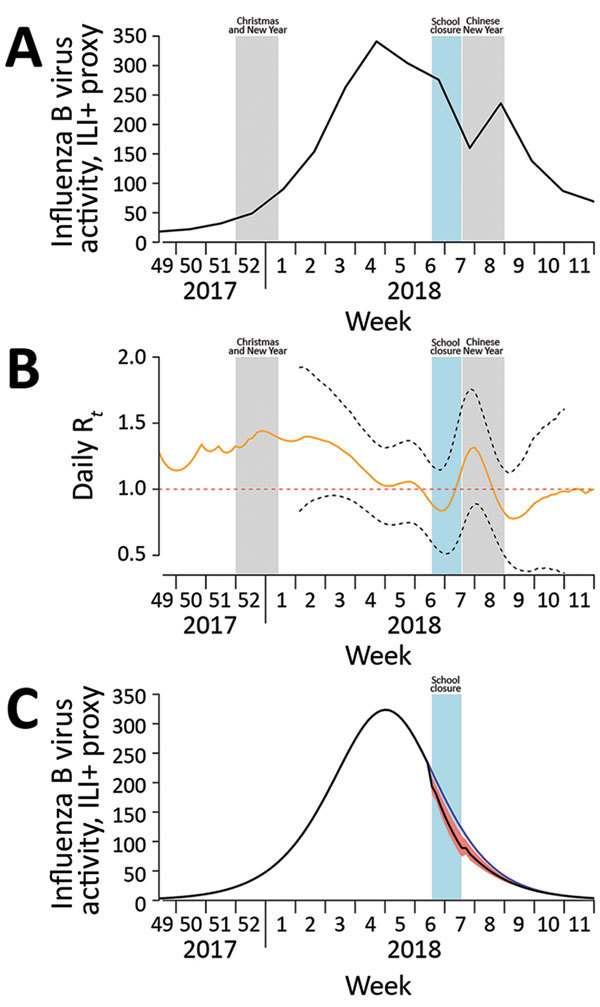
Influenza B virus activity, by epidemiologic week, Hong Kong, December 2017–March 2018. A) Incidence of influenza B virus measured by using the ILI+ proxy for influenza B, which is calculated by multiplying the weekly rate of ILI per 1,000 consultations by the weekly proportion of respiratory specimens submitted to the Public Health Laboratory Services (Hong Kong) that tested positive for influenza B virus (Technical Appendix Table 2). Shaded bars show school closure dates. B) Daily real-time estimate of transmissibility (Rt) of influenza B virus. Black dashed lines indicate pointwise 95% CIs; red dashed line indicates transmission threshold. Shaded bars show school closure dates. C) Simulated incidence of influenza B virus with and without implementation of school closure (shaded bar) in Hong Kong during February 8–14, 2018. Blue line indicates the number of cases occurring during the hypothetical scenario of no school closure; black line indicates the number occurring with school closure, which reduced transmissibility by 16%. The difference between these 2 lines represents the 4.2% reduction in incidence of infections; red shading indicates 95% CI. Rt, effective reproductive number at time t. ILI, influenza-like illness; Rt, effective reproduction number at time t.
