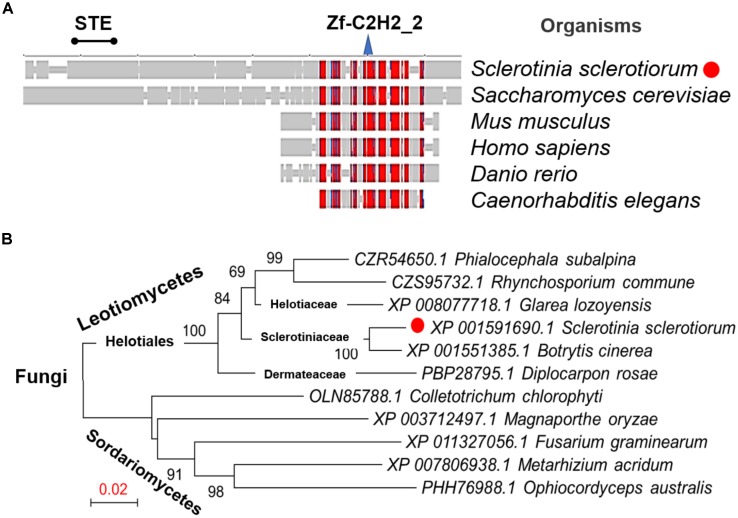
FIGURE 1.
Conservation and phylogenetic analysis of Ste12 proteins. (A) SmartBLAST was used to locate the regions of high sequence conservation in a graphical view among different model organisms. STE motif and zinc-finger C2H2 motif were marked on the top of the graph. (B) Phylogenetic analysis of Ste12 proteins in Sclerotinia sclerotiorum and other fungi. The phylogenetic tree was generated by NJ method, and bootstrap support values of 1,000 replicates are given above the branches.

