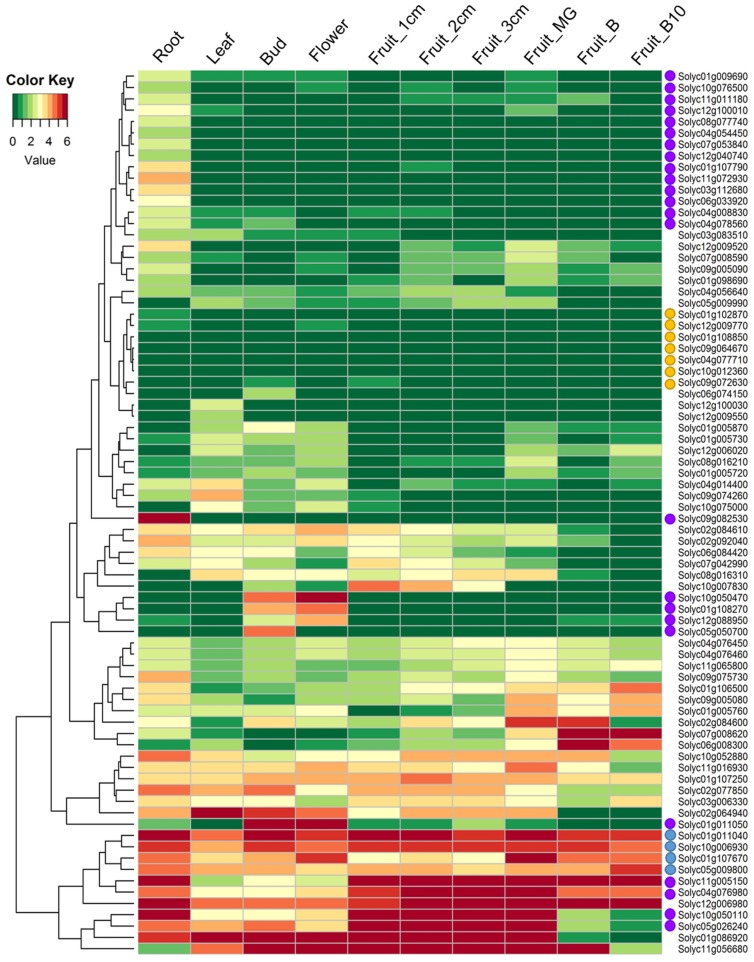
Fig. 3.
Expression profiles of tomato receptor-like protein (RLP) genes across different tissues. The tomato transcriptome data were generated in-house pipeline. Expression data for each gene were normalized to log2[reads per kilobase of per million mapped reads (RPKM)] values and hierarchically clustered. Colors represent relative expression levels. MG, mature green stage; B, breaker stage; B10, 10 days post-breaker. Circles (blue, yellow, and purple) on the left side of gene names indicate tissue specific expressed genes.

