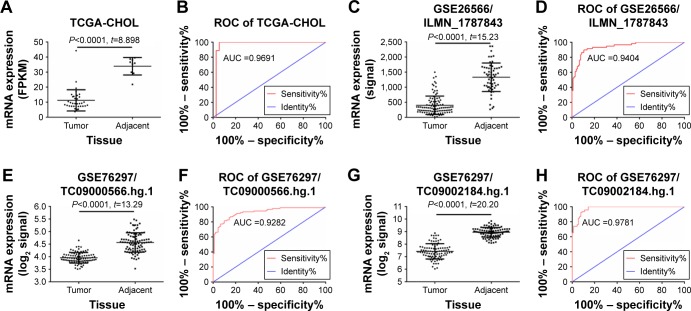
Figure 1.
Relative expression levels of the HSDL2 gene in CCA tissue and adjacent tissue.
Notes: (A) Expression of HSDL2 in CCA tissue and adjacent tissue, based on TCGA data. (B) ROC curve analysis of TCGA data on HSDL2 in CCA tissue. (C) Expression of HSDL2 in CCA tissue and adjacent tissue, based on GSE26566 data (involving the ILMN_1787843 probe) from the GEO database. (D) ROC curve analysis of GSE26566 data on HSDL2 (involving the ILMN_1787843 probe) in CCA tissue. (E) Expression of HSDL2 in CCA tissue and adjacent tissue, based on GSE76297 data (involving the TC09000566.hg.1 probeset) from the GEO database. (F) ROC curve analysis of GSE76297 data on HSDL2 (involving the TC09000566.hg.1 probeset) in CCA tissue. (G) Expression of HSDL2 in CCA tissue and adjacent tissue, based on GSE76297 data (involving the TC09002184.hg.1 probeset) from the GEO database. (H) ROC curve analysis of GSE76297 data on HSDL2 (involving the TC09002184.hg.1 probeset) in CCA tissue.
Abbreviations: CCA, cholangiocarcinoma; HSDL2, hydroxysteroid dehydrogenase-like 2; GEO, Gene Expression Omnibus; ROC, receiver operating characteristic; TCGA, The Cancer Genome Atlas.

