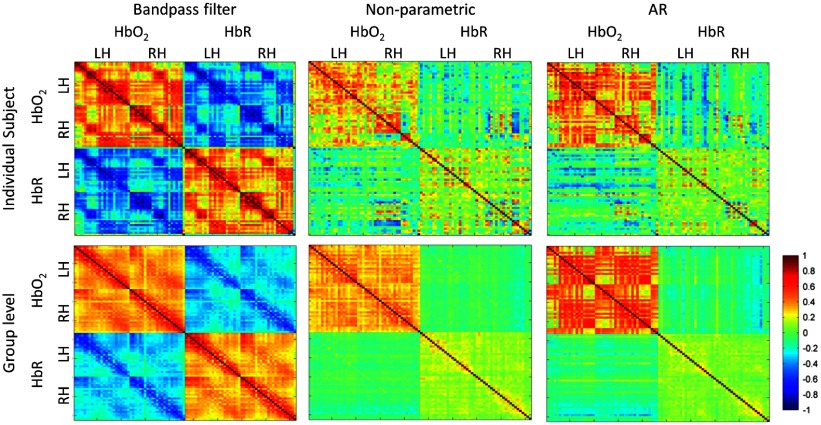
Fig. 5.
FC matrices for an individual subject (first row) and at the group level (second row) for the three types of preprocessing. In each plot, the FC matrix for and HbR is shown in the top-left part and bottom-right part, respectively (RH: channels in right hemisphere, LH: channels in left hemisphere). The FC matrix representing the correlation between and HbR is shown in the top-right. Note that the plots are symmetric with respect to the main diagonal.

