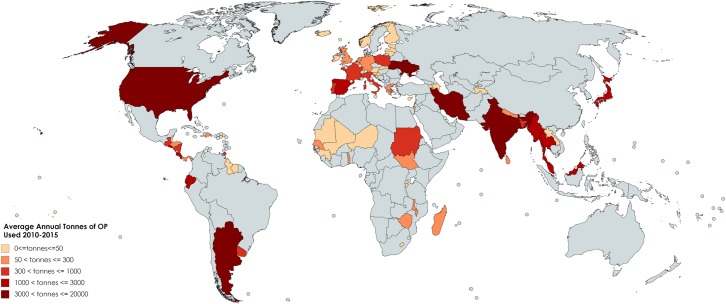
Fig 1. Average annual tonnes of OP pesticides used in agriculture, by country, 2010–2015.
Darker shading indicates greater usage. Gray shading indicates that no data were available during that time period. For countries with data available for some but not all years during 2010–2015, the available data within that period were used. Source for US data was [6]; and for all other countries, [5]. Map created with mapchart.net. OP, organophosphate.

