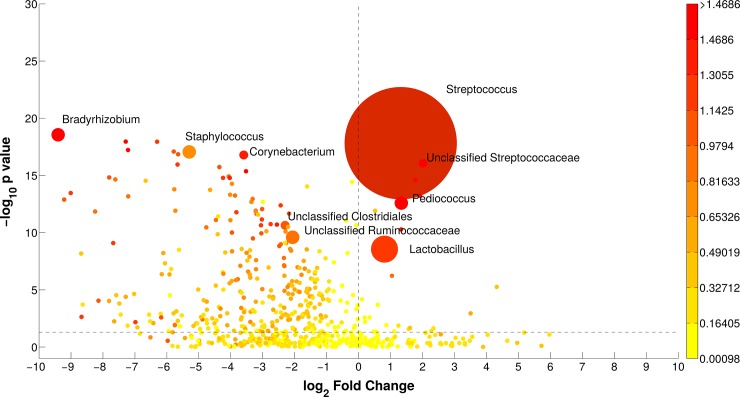
Fig 3. Bubble graph illustrating the groups significantly different between the two breeds (HF and REN) at genus level.
X-axis reports the log2 ratio (REN/HF) of relative abundances; Y-axis depicts the–log10(p-value) of the two-sided Mann-Whitney U-test for comparing bacterial groups; bubble dimension is related to the average relative abundance of sequences; color code is according to Cohen's size effect. Bacterial groups namely indicated are the ones with relative abundance > 1%, p-value < 0.05 and log2(ratio) > 1.5.

