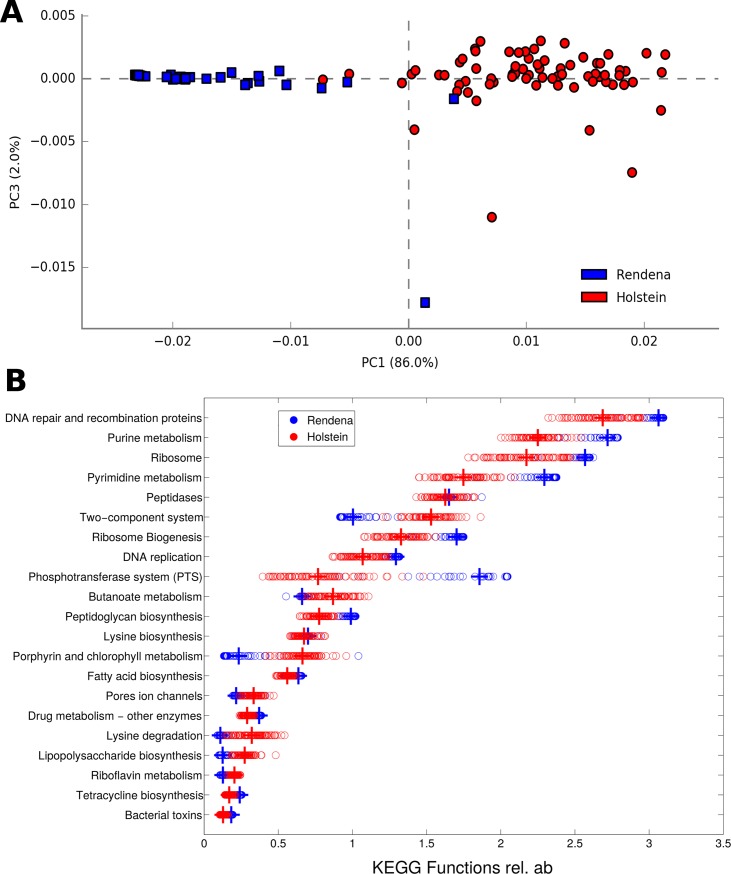
Fig 5. Functional comparison among HF and REN milk microbiota.
(A) PCA of HF (red) and REN (blue) samples based on level 3 KEGG predicted pathways; the difference between breeds is highly significant (p = 0.001). Each dot represents a single quarter milk sample. Percent variance accounted for by the first and third principal component is shown. (B) Dot plot showing the specific level 3 KEGG predicted pathways that are enriched in REN and HF milk quarter samples. Most abundant gene categories for each breed were sorted out and the ratio between their averages was calculated. Only the first 20 significantly different gene categories between cow breeds (p-value < 0.05) are shown.

