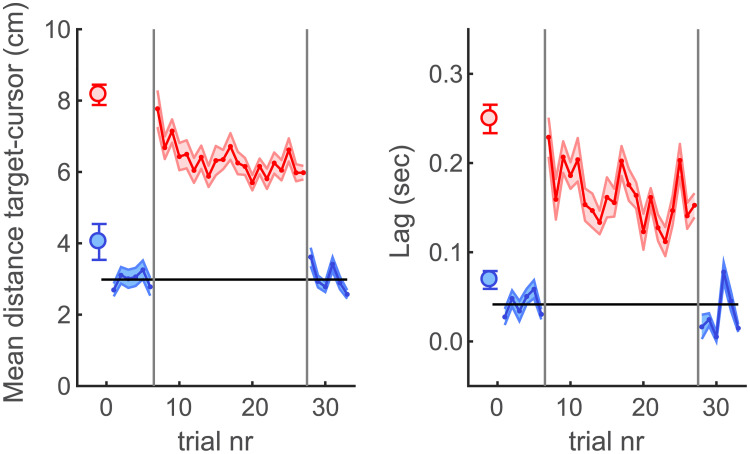
Fig 4. Behavioural results of the tracking task.
The left panel shows the average distance between the target and cursor across the last 18 seconds for each trial. The right panel shows the visual movement time lag between the target and cursor. Blue lines (mean across participants) and shaded areas (standard error of the mean) represent the results for the no-delay trials during the pre- and post-test in the experiment. Red lines and shaded areas represent trials during the exposure phase in which the additional feedback delay of 200ms was present. The black horizontal line represent the average across the first six trials in the experiment (no-delay pretest) as a visual reference for investigating both direct effects of the added feedback delay as well as potential adaptation aftereffects in the post-test. The vertical grey lines represent the beginning and end of the delay exposure phase. The blue and red circles on the left-hand side represent the average results for the No-Delay and Delay conditions in the Methods Test part of the experiment for comparison.

