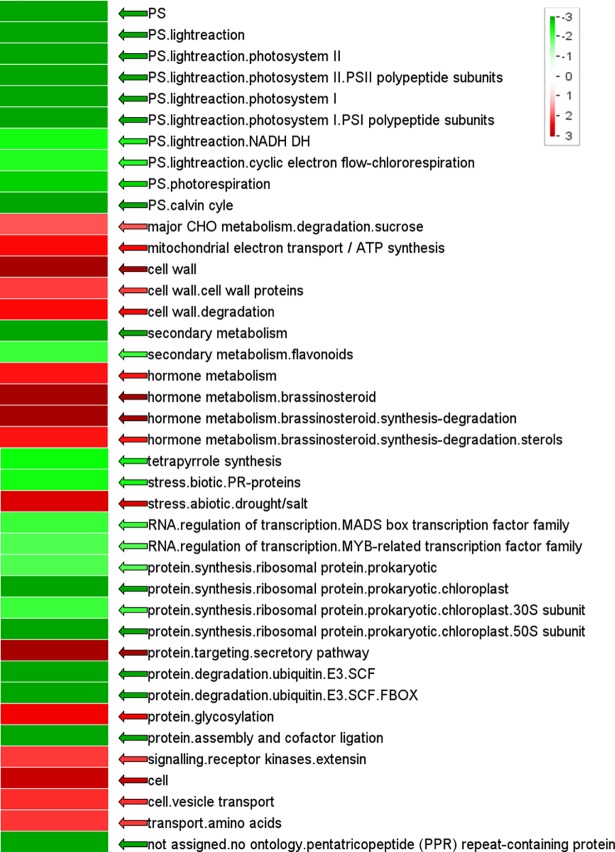
Fig 5. Enrichment of functional gene categories in gall tissue.
Red and green indicate increased or decreased enrichment in gall tissue, respectively. Statistics were performed via the Wilcoxon test (with false discovery rate using the Benjamini-Hochberg procedure). Increased intensity of green and red represented increasing level of down- and up-regulation, respectively.

