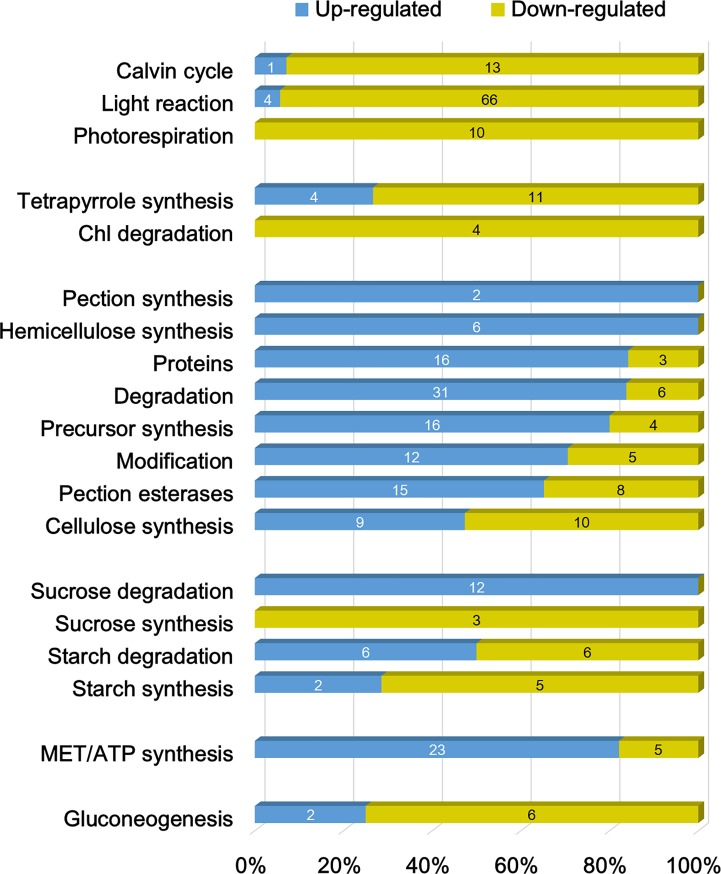
Fig 6. Ratio of up- and down-regulated genes among genes with at least 2-fold change in different functional groups.
The groups associated with photosynthesis, tetrapyrrole, cell wall metabolism, major carbohydrate (CHO), mitochondria, and gluconeogenesis are demonstrated. Arabic number in each bar represents the gene number. Detailed descriptions of genes are listed in S2 Table.

