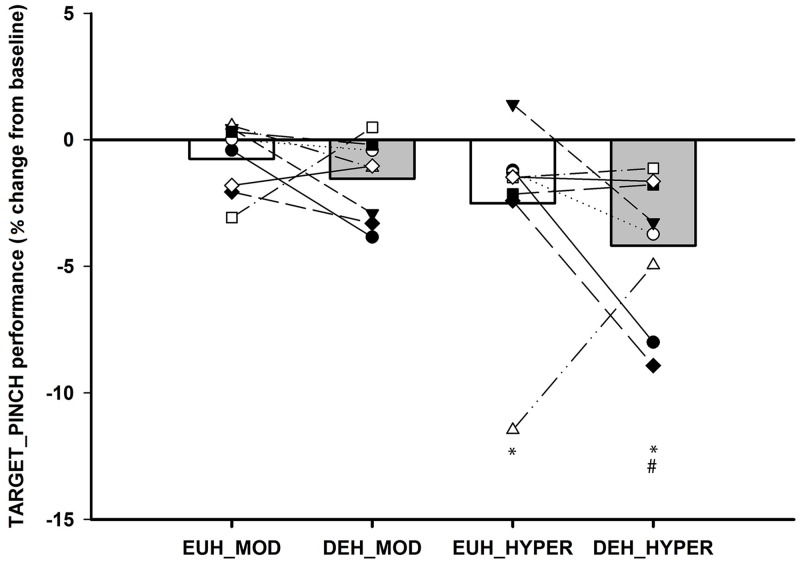
Fig 3. TARGET_PINCH performance score.
Individual and mean changes in TARGET_PINCH performance with white bars representing euhydration (EUH: MOD and HYPER) and gray bars the dehydration session (DEH: MOD and HYPER). Values are expressed in percentage change from BASELINE (BASELINE expressed as 0) and individual participant changes in each condition and session. * Significantly different from BASELINE, # Significantly different from MOD (P<0.05).

