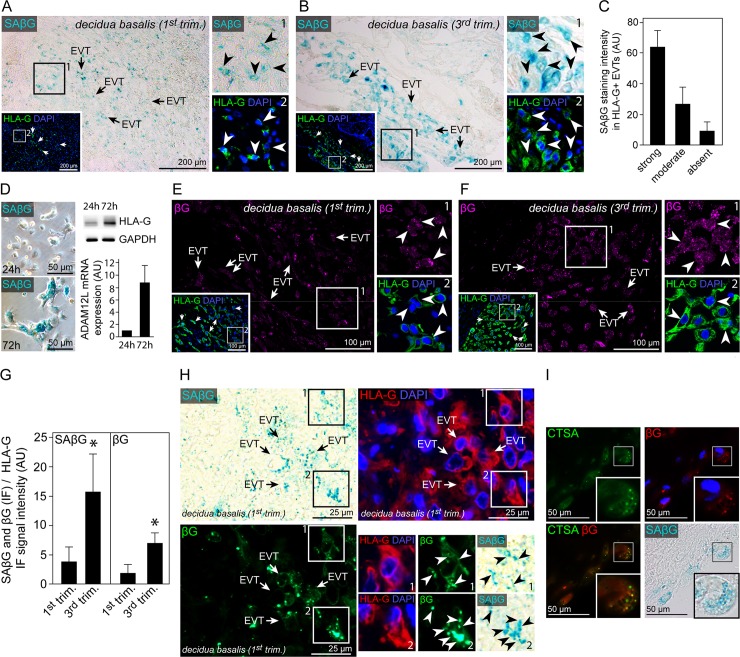
Fig 3. Senescence-associated β-galactosidase activity in HLA-G positive invasive, decidual EVTs co-localizes with beta-galactosidase protein and lysosomal cathepsin A.
(A) Cryo-section of first trimester decidua basalis tissue (n = 7) showing co-stained SAβG activity (blue, large image) and HLA-G (green, insert). (B) Cryo-section of third trimester decidua basalis tissue (n = 6) showing co-stained SAβG activity (blue, large image) and HLA-G (green, insert). (C) Quantification of SAßG staining intensity in first trimester HLA-G+, deciudal EVTs. (D) SAβG activity in isolated primary human trophoblasts after 24 hrs (top) and 72 hrs (bottom) of cultivation (left panel). Western blot analysis (n = 3) of the same cultures showing increasing HLA-G+ and ADAM12L expression in differentiating EVTs after 72 hrs of cultivation. (E) Section of the same first trimester decidua basalis tissue (n = 3) depicted in A showing βG (magenta, large image) and HLA-G (green, boxed insert) co-staining. (F) Section of the same third trimester decidua basalis tissue (n = 3) depicted in B showing βG (magenta, large image) and HLA-G (green, boxed insert) co-staining. (G) Ratio of SaβG and βG relative to HLA-G signal intensities in first (n = 6) and third (n = 7) trimester decidua basalis tissue sections. (H) Section of first trimester paraffin-embedded decidua basalis tissue (n = 3) showing SAβG activity (blue), HLA-G (red) and βG (green) co-staining. (I) IF staining of SAβG (blue) expressing, decidual EVTs with antibodies against βG (red) and CTSA (green) (n = 3). The picture in the lower left corner represents a merged image of the green (CTSA) and red (βG) channel. Zoomed insets on the right show image details of the boxed area, arrowheads indicate SAβG (A and B) or βG (E and F) and HLA-G double positive cells. In (H) zoomed insets represent HLA-G, βG and SAβG triple positive regions marked by arrow heads. DAPI was used to visualize nuclei.

