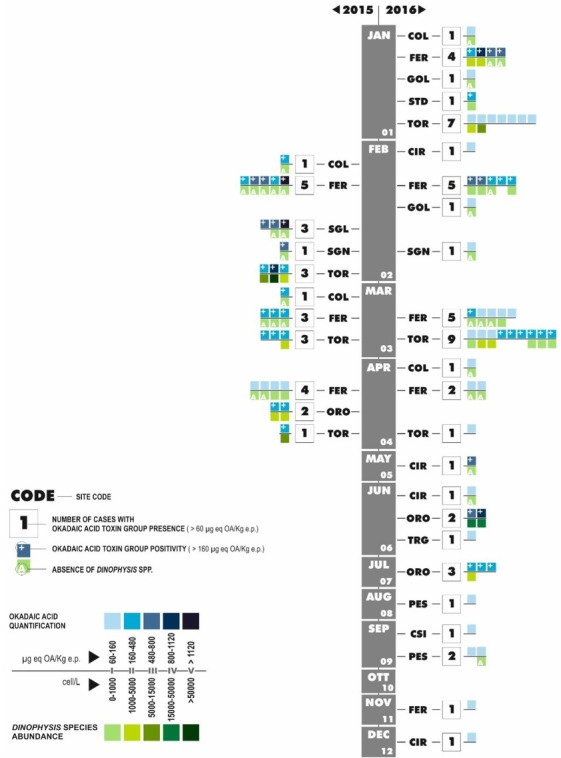
Fig. 2.

Monthly numbers of cases (within the bigger squares) with okadaic acid toxin group in shellfish farms (identified with own site codes) during 2015 (left) and 2016 (right). Classes of okadaic acid toxin group quantification (smaller squares above the line) and Dinophysis spp. abundance (smaller squares below the line) are shown. Plus sign indicates values exceeding the legal limit for okadaic acid toxin group concentration. Letter A indicates the absence of Dinophysis spp.
