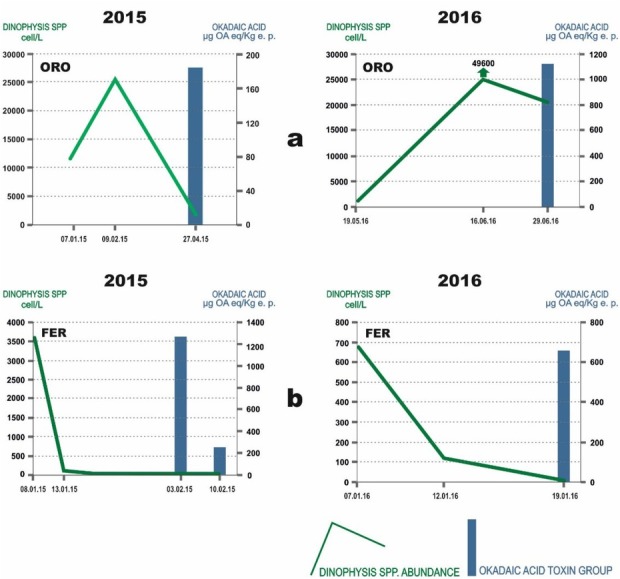
Fig. 3.

Examples of the relationship between Dinophysis spp. cell abundance (green line) in seawater and the presence of okadaic acid toxin group (blue bar) in shellfish during 2015 (left side of figure) and 2016 (right side). The X-axis lists the dates of seawater and shellfish sampling; the left-hand Y-axis shows the values of Dinophysis species abundance (cell/L) and the right-hand Y-axis shows the okadaic acid toxin group concentration (μg OA eq/kg e.p.). a – increase in okadaic acid toxin group concentration concomitant with a decrease in Dinophysis spp. cell abundance in Orosei (ORO); b – presence of okadaic acid toxin group concomitant with Dinophysis spp. absence in Feraxi (FER)
