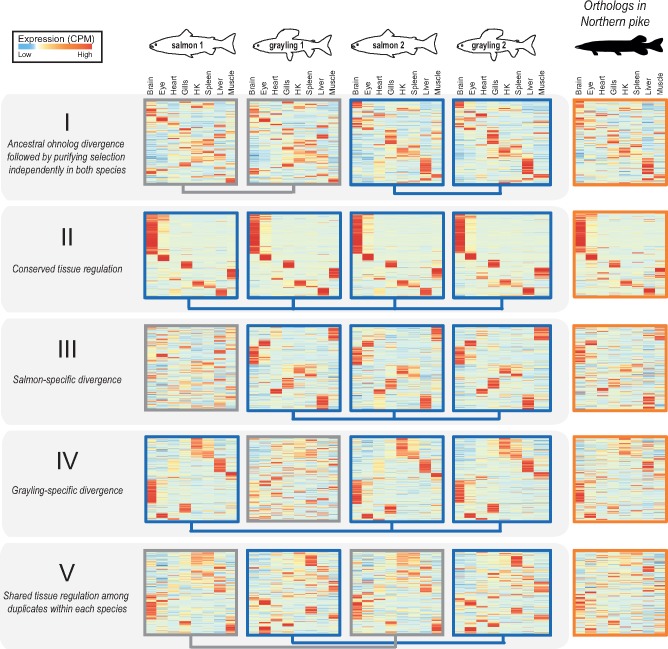
Fig. 3.
—Selection on tissue expression regulation after whole-genome duplication. Heatmaps show clustering of tissue expression of the ohnolog-tetrads for each of the five evolutionary scenarios of tissue expression regulation following Ss4R WGD (see table 2). Within each category, the first four heatmaps represent one ohnolog-tetrad (i.e., four genes: salmon1, grayling1, salmon2, and grayling2) that were ordered based on similarity of expression profiles with the corresponding orthologs in northern pike (the fifth heatmap depicted on the right). Darker red corresponds to the highest expression level observed for one gene, and the darker blue to the lowest (scaled CPM). Connecting blue lines below the heatmaps indicate duplicates belonging to the same tissue clusters (conserved expression pattern). (An extended figure with ohnolog-tetrads subdivided into LORe and AORe in supplementary fig. S6, Supplementary Material online.)

