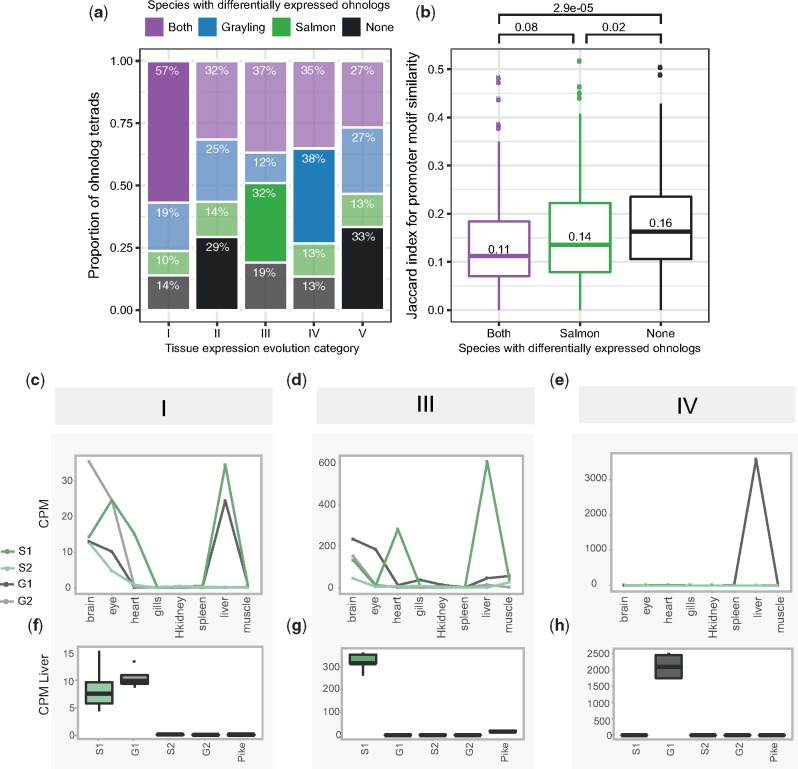
Fig. 4.
—Expression level evolution of the ohnolog-tetrads. (a, b) Ohnolog-tetrads were tested using liver expression data for cases of highly significant differential expression (FDR-adjusted P-value <10−3, absolute FC >2) between ohnologs of both species (purple), grayling ohnologs only (blue), Atlantic salmon ohnologs only (green), and no ohnologs of either species (black). Ohnolog tetrads shown in the figure had at least one ohnolog assigned to a tissue expression cluster displaying dominant expression in liver. The differential expression outcome expected to be the highest for each category is highlighted opaque, while the remaining outcomes are transparent. (a) The number and proportions of cases are given per tissue expression evolution category (see table 2). The differential expression outcome expected to be the highest for each category is highlighted opaque, while the rest are transparent. (b) Jaccard index score distributions for Atlantic salmon ohnolog promoter motif similarity, separated by differential expression outcome. P-values from pairwise comparisons testing for lower Jaccard index using the Wilcoxon test are indicated—as well as the median scores. The expression levels, in terms of CPM, from the tissue atlas data (c–e) and the corresponding data from the liver expression data are plotted (boxplots in f–h) for a selected example with a liver-specific gain of expression in each of the categories I, III, and IV. The examples indicated in (c–h) include ohnologs of ephrin type-B receptor 2-like (category I), contactin-1a-like gene (category III), and an E3 ubiquitin-protein ligase-like gene (category IV). The ohnologs in Atlantic salmon and grayling are represented as S1, S2 and G1 and G2, respectively.

