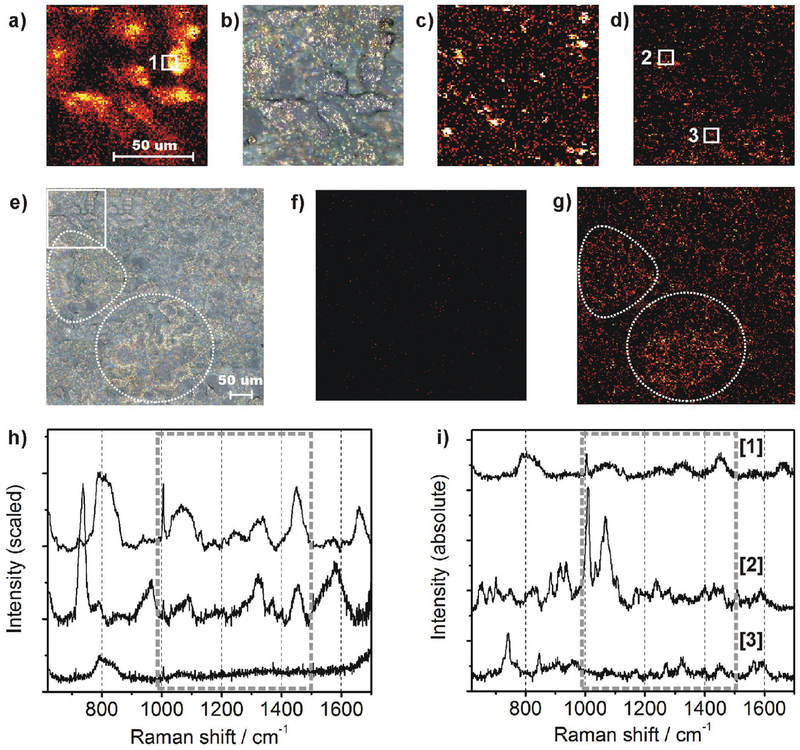
Figure 5.
a) Intrinsic Raman image of COS cells, 101 × 101 μm, maximum intensity projection at 1450 cm−1. b) The same area as in panel (a) using brightfield microscopy (500× magnification) and after application of SDN particles (bright spots). c) Raman experiment after SDN coating, acquisition time and laser intensity were reduced by factor 10 and 50, respectively. d) Correlation analysis (Pearson) between SERS spectra and an intrinsic Raman reference spectrum of the cell membrane. Only correlation coefficients above 0.5 were considered and arranged in a thermal color scheme. e) Bright-field image of a large area (402 × 402 μm) after SDN application. Prominent sample structures are highlighted by dashed circles. f) Raman result of the same area without SDN particles, acquisition time as in (c). g) Scan after SDN application, the data were processed as in (c). Sample structures from (e) are highlighted by dashed circles again. h) Averaged spectra collected from the sample. Upper line: Average of 18 intrinsic spectra collected within the white square in (b). Middle line: Average of 40.400 SERS spectra collected after SDN application. Lower line: Control experiment, average of 40.400 spectra from the image shown in (f), collected before SDN application, scan parameters as in (c). i) Manual selection of three prominent spectra without averaging and scaling. Upper line: Intrinsic reference spectrum of the cell membrane without SDN. Middle and lower line: two single-shot SERS spectra, collected at the white squares in (d).

