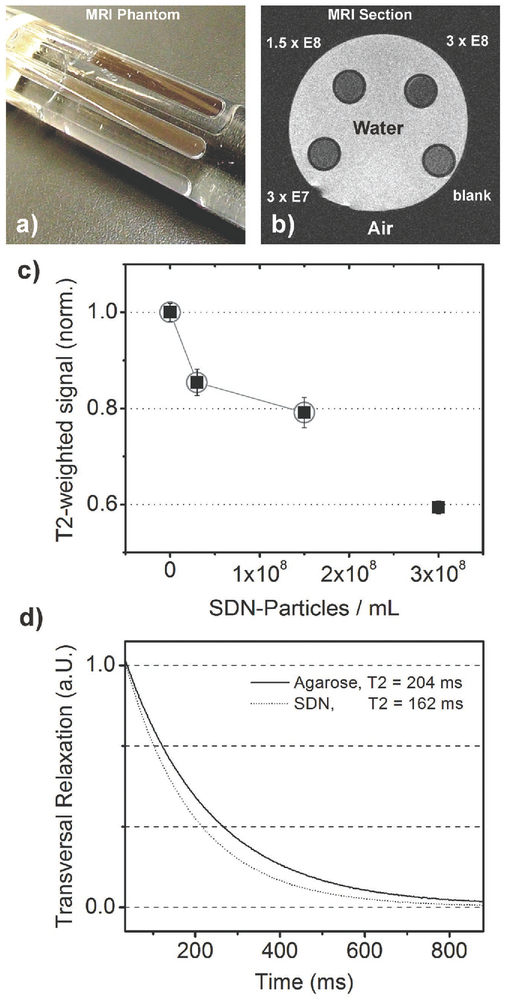
Figure 6.
a) Photograph of a phantom for MRI. Test tubes containing different concentrations of SDN in aqueous solution and plain agarose in water (as a reference) were arranged in parallel and placed in a larger plastic tube filled with water. b) Axial section of this phantom shows darkening of the test tubes while SDN concentrations increase. c) Plot of T2-contrast relative to the reference. d) T2-relaxation curves for plain agarose (solid line) and an SDN concentration of 3 × 10⁷ particles mL−1.

