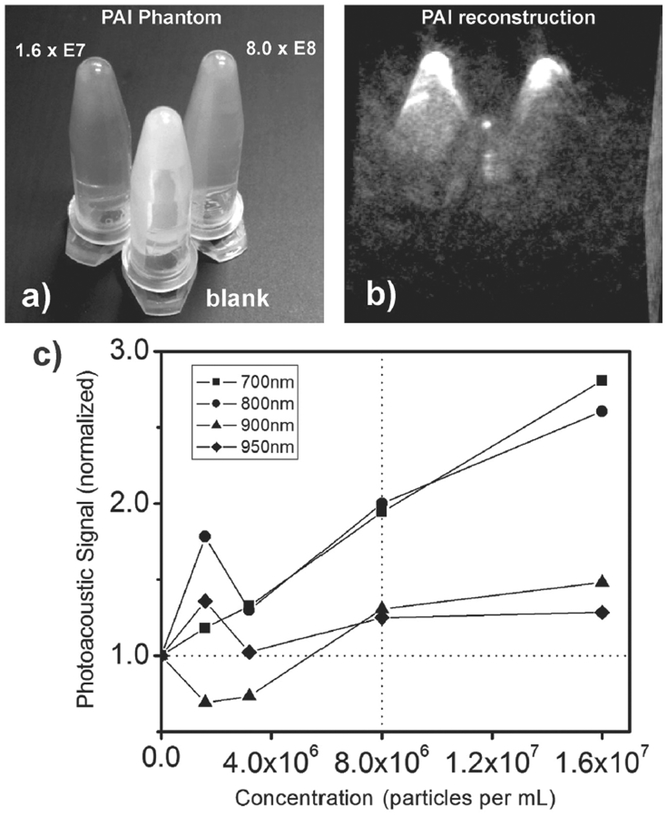
Figure 7.
a) Photograph of Eppendorf tubes filled with different SDN concentrations (rear left and rear right) and plain agarose (in front) for photoacoustic imaging. b) The tomographic reconstruction (3D volume rendering) of the photoacoustic data. c) Plot of the photoacoustic signal as a function of SDN concentrations at four different wavelengths of excitation. The results are shown as square (700 nm), circle (800 nm), triangle (900 nm), and diamond (950 nm).

