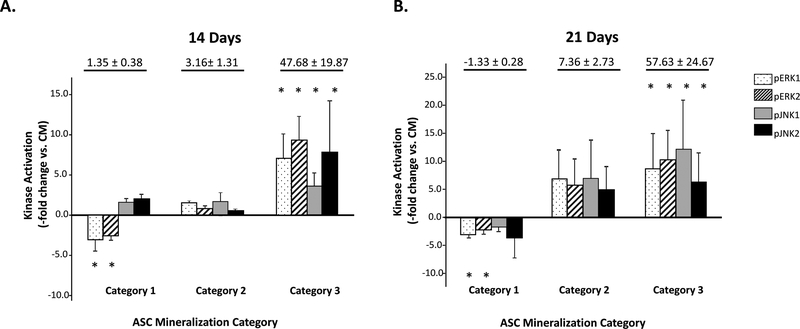
Figure 2: ASC mineralization correlates to ERK1/2, JNK1/2 activation.
ASC populations (n=15) after OM induction for 14 (Panel A) or 21 days (Panel B) are shown categorized based on mineralization and activation level of ERK1/2 and JNK1/2 (pERK1/2, pJNK1/2) versus non-induced controls (Kinase Activation – fold change vs. CM). ASCs were determined to have: 1) negligible mineralization versus CM controls (Category 1); 2) moderate mineralization versus controls (Category 2) or 3) enhanced mineralization versus controls (Category 3). TAverage mineralization levelfor each Category is given at the top of the graph. * indicates a significant difference in kinase activation vs controls (p<0.05; t-test). ANOVA also confirmed a statistically significant difference between the Category 1 and Category 3 activation levels.

