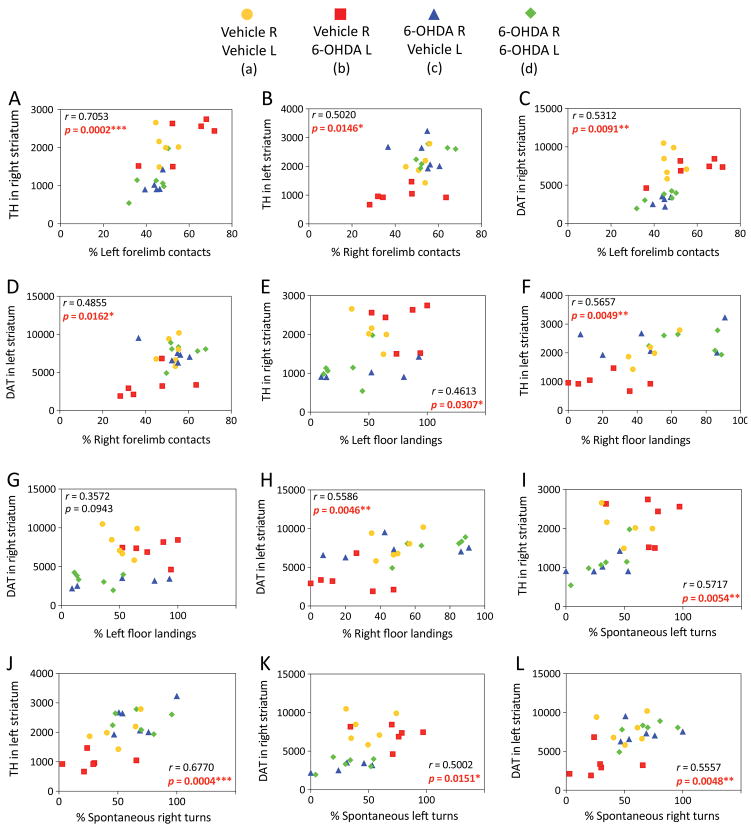
Figure 3. Linear correlations between structural and functional outcomes of cross-hemispheric preconditioning in experimental Parkinson’s disease.
Mice were preconditioned with 6-OHDA, as described in the legend of Figure 2, and behavioral and histological outcomes were measured, as described in our previous report (Weilnau et al., 2017). Raw striatal TH or DAT measurements (arbitrary fluorescence units) were employed as indicators of the structural integrity of nigrostriatal axon terminals and plotted as a function of the percentage of left versus right forelimb contacts with a vertical wall (A–D), left versus right forelimb landings on the floor (E–H), and left versus right spontaneous turns (I–L), as measured 7 or 14 days after the second hit (data from Weilnau et al., 2017). Two-tailed Pearson correlation analyses were applied to all the data. The Pearson correlation coefficient r and the corresponding p value are shown. Statistically significant results are present in red font. Each animal is represented as one dot and each group is represented by a unique color and symbol. Note that some of the values are so similar that the dots overlap. n = 5–6 mice per group.

