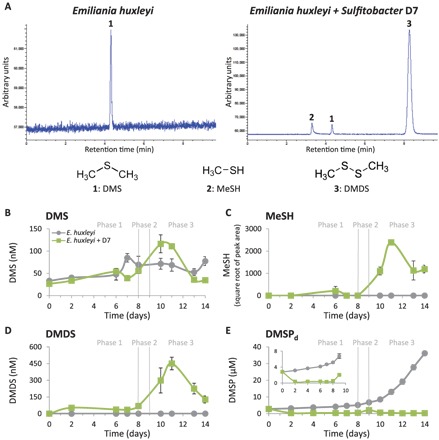
Fig. 3. A major shift in the composition of VOSCs during the pathogenic phase of Sulfitobacter D7 infection of E. huxleyi.

(A) Representative GC–flame photometric detector (GC-FPD) chromatograms of VOSCs detected in media of monocultures and Sulfitobacter D7–infected E. huxleyi 379 cultures at phase 3 (t = 11 days). Peaks are marked by numbers that represent different compounds, as indicated below. DMDS is presumably an oxidation product of MeSH (fig. S5C) and therefore considered as part of the MeSH pool. (B to E) Quantification of VOSCs; (B) DMS, (C) MeSH, (D) DMDS, and (E) dissolved DMSP (DMSPd) in media of control (gray line) and Sulfitobacter D7–infected (green line) E. huxleyi 379 cultures during defined phases (1 to 3), as described in Fig. 1. Inset in (E): zoomed-in view of DMSPd concentration during phases 1 and 2. Algal growth, algal cell death, and bacterial growth are presented in fig. S9. Results depicted in (B) to (E) represent average ± SD (control, n = 4; Sulfitobacter D7–infected, n = 2). Error bars smaller than the symbol size are not shown. Statistical differences in (B) to (E) were tested using repeated-measures ANOVA. P < 0.001 for the differences between control and cocultures, except for DMS.
